
A dated comparison of CloudWatch Logs classes, Microsoft Sentinel tiers and Cloud Logging storage levers, built from provider documentation and list prices read on October 7, 2026. It gives a capability-loss matrix, an ingestion price chart in one unit, a placement decision tree and a parallel-run test procedure.
At a glance
Key findings
- CloudWatch Logs Infrequent Access halves custom log ingestion in us-east-1 but has no metric filters or subscription filters, and a log group's class cannot be changed after creation. [1][2]
- Switching a Sentinel table to the data lake tier stops its real-time analytics and hunting queries; KQL jobs and summary rules bring results back with documented delays. [7][12][13]
- Cloud Logging has no cheaper storage class, and log-based alerting policies ignore excluded entries while user-defined log-based metrics still count them. [16][18]
- Query scans become the main cost on the cheaper side, priced at $0.005 per GB scanned for both CloudWatch Logs Insights and Sentinel lake queries. [2][9]
What changes when a log changes tier
Move a log source to a cheaper tier only when nothing that must fire in near real time reads it. High-volume context such as flow, firewall, proxy, storage access and verbose application logs usually qualifies. Sources that feed metric filters, subscription filters, scheduled analytics rules or log-based alerts do not, until each of those detections has been rebuilt on a mechanism the cheaper tier supports and the rebuilt version has been shown to fire.
The reason is the same on all three platforms: the discount is paid for by removing the streaming hooks that detection depends on. A CloudWatch Logs group in the Infrequent Access class costs half as much to ingest custom logs into as a Standard group in us-east-1, but it has no metric filters, no subscription filters, no Live Tail and no anomaly detection. [1][2] A Microsoft Sentinel table switched from the analytics tier to the data lake tier stops serving real-time analytics and hunting queries. [7] Cloud Logging has no discount class for ordinary logs at all; its saving comes from excluding or rerouting entries, and log-based alerting policies only match entries that were not excluded. [16][18]
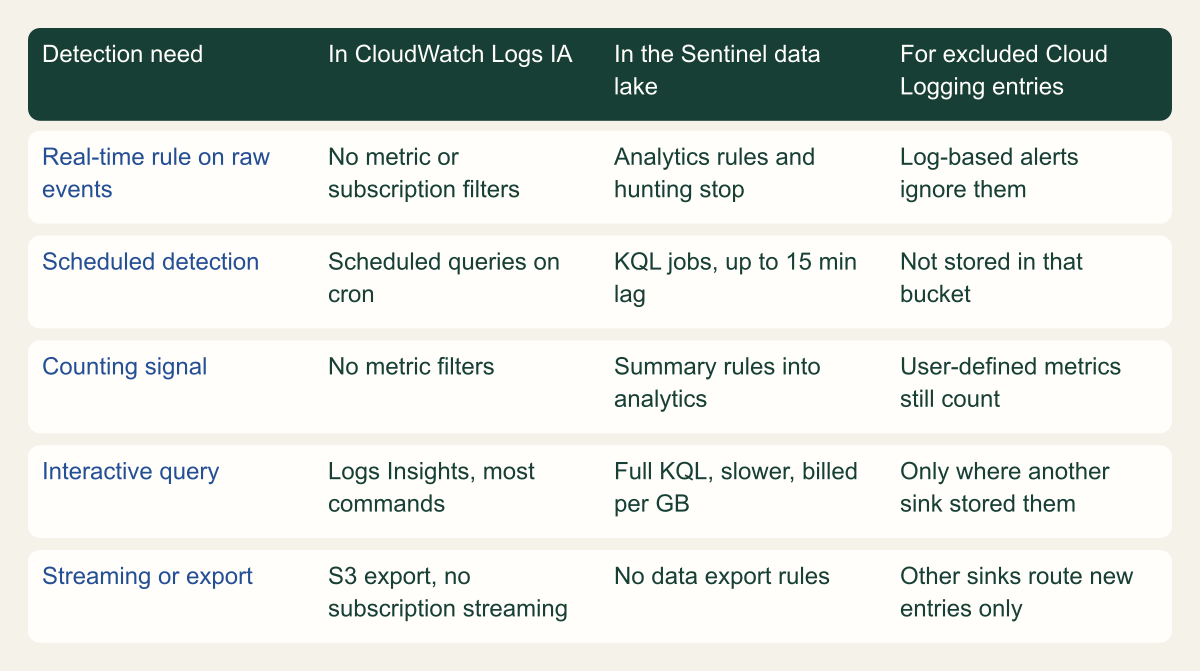
That makes price per GB the wrong unit for the decision. The useful unit is the reader: every rule, metric, alarm, dashboard, export or compliance control that consumes the source. A source can move when each reader is either not a detection, or can be rebuilt as a scheduled query, a KQL job, a summary rule or a log-based metric whose added delay the detection owner has accepted in writing. The matrix below shows which capability each cheaper option removes and what replaces it.
Prices in this guide are list prices read on October 7, 2026 for us-east-1 (AWS), East US (Azure) and Google's published Cloud Logging rate. Feature statements follow the provider documentation on the same date. Nothing here was run against a live account, and every scenario labeled hypothetical is an illustration, not an observed deployment.
What each cheaper option removes
Every discount removes the real-time path; each platform offers a scheduled substitute with added delay. [1][7][12][18]

Source. Conceptual comparison synthesized from AWS, Microsoft and Google documentation reviewed October 7, 2026. [1][3][4][7][12][13][17][18]
Method. Conceptual matrix. Cells summarize documented feature support for each cheaper option; they are not measurements and omit features unrelated to detection.
Accessible table and figure data
| Detection need | In CloudWatch Logs IA | In the Sentinel data lake | For excluded Cloud Logging entries |
|---|---|---|---|
| Real-time rule on raw events | No metric or subscription filters | Analytics rules and hunting stop | Log-based alerts ignore them |
| Scheduled detection | Scheduled queries on cron | KQL jobs, up to 15 min lag | Not stored in that bucket |
| Counting signal | No metric filters | Summary rules into analytics | User-defined metrics still count |
| Interactive query | Logs Insights, most commands | Full KQL, slower, billed per GB | Only where another sink stored them |
| Streaming or export | S3 export, no subscription streaming | No data export rules | Other sinks route new entries only |
| Detection need | In CloudWatch Logs IA | In the Sentinel data lake | For excluded Cloud Logging entries |
|---|---|---|---|
| Real-time rule on raw events | No metric or subscription filters | Analytics rules and hunting stop | Log-based alerts ignore them |
| Scheduled detection | Scheduled queries on cron | KQL jobs, up to 15 min lag | Not stored in that bucket |
| Counting signal | No metric filters | Summary rules into analytics | User-defined metrics still count |
| Interactive query | Logs Insights, most commands | Full KQL, slower, billed per GB | Only where another sink stored them |
| Streaming or export | S3 export, no subscription streaming | No data export rules | Other sinks route new entries only |
AWS CloudWatch Logs classes
CloudWatch Logs offers Standard and Infrequent Access classes, plus a Delivery class meant only for passing Lambda logs through to Amazon S3 or Data Firehose with a short, fixed retention. The class is set by logGroupClass at creation and can never be changed afterward. [1] Moving a source to IA therefore means creating a new log group and repointing the producer: the trail's CloudWatch Logs destination, the flow log, the agent configuration. History already ingested stays in the old Standard group until its retention expires, so investigations spanning the cutover need to query both groups.
AWS states that the two classes differ only in ingestion cost; storage and Logs Insights charges are identical. [1] In the us-east-1 offer file published on October 7, 2026, custom log ingestion is $0.50 per GB in Standard and $0.25 per GB in IA, storage is $0.03 per GB-month and Logs Insights scanning is $0.005 per GB. [2] Vended logs from AWS services follow a separate tiered schedule in both classes.
IA keeps more than its reputation suggests. It supports Logs Insights, OpenSearch PPL and SQL, cross-account observability, KMS encryption, data masking, export to S3, the S3 Tables integration, CloudWatch pipelines and scheduled queries. [1] Within Logs Insights, every command works except pattern, diff, filterIndex and unmask. [3] What it drops is the real-time path: metric filters, subscription filters, Live Tail, anomaly detection, field indexing, facets, embedded metric format, Container Insights and Lambda Insights ingestion, and the GetLogEvents and FilterLogEvents API operations. [1]
Metric filters are where most CloudWatch-native detection lives. Security Hub CSPM controls CloudWatch.1 through CloudWatch.14 each expect a metric filter and alarm on the CloudTrail log group, covering root user activity, unauthorized API calls, console sign-in without MFA, IAM policy changes, CloudTrail configuration changes, security group changes and related events. [5] Recreate that log group as IA and none of those filters can exist there. Subscription filters carry the other common pattern, streaming a group to Kinesis, Data Firehose or a Lambda forwarder that feeds an external SIEM; IA removes that feed as well.
Scheduled queries are the documented replacement inside IA. A scheduled query runs a Logs Insights, PPL or SQL query on a cron schedule in UTC and delivers results to an S3 bucket, an EventBridge event bus or a lookup table. [4] The EventBridge event carries query metadata and statistics such as resultCount, not the rows; a consumer must call GetQueryResults with the queryId, and results remain available for 30 days. AWS also warns that a missing resultCount should be treated as unknown rather than zero, which matters if an alert triggers on that field. [4] This is a polling detection with a lookback window, so it inherits the late-arrival problems of any scheduled rule, and each run scans data that is priced per GB. [2]
One dependency does not move with your log groups. GuardDuty reads CloudTrail management events, VPC flow logs and Route 53 Resolver DNS logs through independent, duplicated streams, and your own CloudTrail and flow log configuration does not affect it. [6] Recreating a flow log destination as IA leaves GuardDuty findings intact while removing any metric filters you built on the old group.
# Example only. Run with read-only CloudWatch Logs permissions in one Region.
# 1. Standard log groups that still drive metric filters (these break under IA).
aws logs describe-log-groups --log-group-class STANDARD \
  --query 'logGroups[?metricFilterCount > `0`].[logGroupName,metricFilterCount,retentionInDays]' \
  --output table

# 2. For one candidate group, list the streaming consumers that IA would cut off.
LG="/example/cloudtrail/management-events"
aws logs describe-metric-filters --log-group-name "$LG" \
  --query 'metricFilters[].[filterName,filterPattern]' --output table
aws logs describe-subscription-filters --log-group-name "$LG" \
--query 'subscriptionFilters[].[filterName,destinationArn]' --output tableMicrosoft Sentinel tiers
Microsoft Sentinel stores tables in an analytics tier or a data lake tier. The analytics tier supports alerting, hunting, workbooks and every other Sentinel feature, keeps 90 days for Sentinel tables according to Microsoft's comparison table (another passage on the same page describes 30 days extendable to 90 at no cost) and 30 days for Defender XDR tables, extends to two years and is mirrored to the lake by default, with total retention up to 12 years. [7] Lake-only data is not available to real-time analytics or threat hunting. Microsoft's comparison lists limitations on analytics rules, hunting queries, parsers, watchlists, workbooks and playbooks, marks lake queries as slower and not included in the price, and offers neither restore nor data export from the lake. [7]
Microsoft's own guidance draws the line by data category. Authentication logs, cloud audit trails, EDR logs and threat intelligence are primary security data for the analytics tier, while storage access, NetFlow, TLS certificate, firewall, proxy and IoT logs are secondary data suited to the lake. [11]
The data lake became generally available on September 30, 2025, and the $0.10 per GB data processing charge applied from October 1, 2025. [10] Lake ingestion and processing are charged only for tables whose retention is set to the lake tier alone; a table kept in both tiers pays analytics ingestion and gets the mirror without those two charges. Lake storage is billed per GB-month after analytics retention ends, at a uniform 6:1 compression ratio, and queries are billed per GB of uncompressed data scanned. [8] On the East US price list that means $0.05 ingestion plus $0.10 processing per GB, $0.026 per GB-month stored and $0.005 per GB queried. [9]
Defender XDR tables behave differently. Ingesting a supported XDR table directly into the lake still leaves 30 days of that data in the analytics tier at no additional cost, so advanced hunting over the most recent month continues to work. [7]
Two mechanisms carry lake data back into detection. KQL jobs run one-time or on a schedule from By minute to Monthly and can write results into an analytics-tier table suffixed _KQL_CL, where analytics rules can read them. [12] Their limits shape detection design: newly ingested lake rows can take up to 15 minutes to become queryable, a job's first run must start at least 30 minutes after creation, each tenant gets five concurrent job executions (extra requests are rejected, not queued) and 100 enabled jobs, a job query times out after one hour and may promote partial results, and TimeGenerated is overwritten when it is older than two days unless the original time is copied to another column. [12] Microsoft recommends ending each window at now() minus the expected delay.
Summary rules are the second path. They aggregate a source table over a fixed bin of 20, 30, 60, 120, 180, 360, 720 or 1440 minutes and re-ingest the results into an Analytics table. The default wait before a bin runs is between three and a half minutes and 10 percent of the bin size, adjustable with binDelay. Queries over Basic, Auxiliary or lake sources are limited to a single table (for Basic sources, lookup can join up to five Analytics tables), and a failing bin is retried ten times over eight hours before it is skipped. [13]
Workspaces that still use the Azure Monitor table plans have a middle option. Basic tables have reduced ingestion, per-GB query charges and only Simple Log Alerts, while Auxiliary tables have no alerts at all. [14] Moving a table from Analytics to Auxiliary stops its alerts, and a table can change plan only once a week, so a mistaken move cannot be reversed the same afternoon. [15]
Google Cloud Logging storage
Cloud Logging charges a one-time $0.50 per GiB to store ordinary logs in a log bucket, which includes up to 30 days of storage and all querying; the first 50 GiB per project per month is free. Vended network logs (VPC Flow Logs, Firewall Rules Logging and Cloud NAT) cost $0.25 per GiB, retention beyond 30 days costs $0.01 per GiB-month, and the _Required bucket is free with a fixed 400-day retention. The Log Router and Log Analytics add no charge, and units are binary. [16] There is no cheaper storage class to move a log into, so the levers are exclusion filters, routing to another destination, and retention length.
Each lever touches detection differently. Log-based alerting policies match only included entries. User-defined log-based metrics are calculated from both included and excluded entries, while system-defined log-based metrics count included entries only. [18] An exclusion filter added to the _Default sink to save storage therefore leaves a counter metric, and any alerting policy on that metric, working while silently disabling a log-based alert written against the same events.
Routing has its own traps. A sink cannot route entries received before it was created, so a new destination never backfills. [17] Every bucket that stores an entry is charged for it, which means routing the same entry to three buckets in one project bills that project three times. [16] Excluding VPC flow logs from Logging does not make them free either: once they are not ingested into Logging, the flow log generation charge applies. [16] Logs sent to Cloud Storage become objects in a bucket, so any detection on them needs a different engine.
The _Required sink cannot be modified and routes Admin Activity, System Event and Access Transparency audit logs to the _Required bucket. [17] Alerts on those logs survive any exclusion you add to _Default. Data Access audit logs land in _Default, which is where exclusions, and their side effects on log-based alerts, actually bite.
Compare list prices in one unit
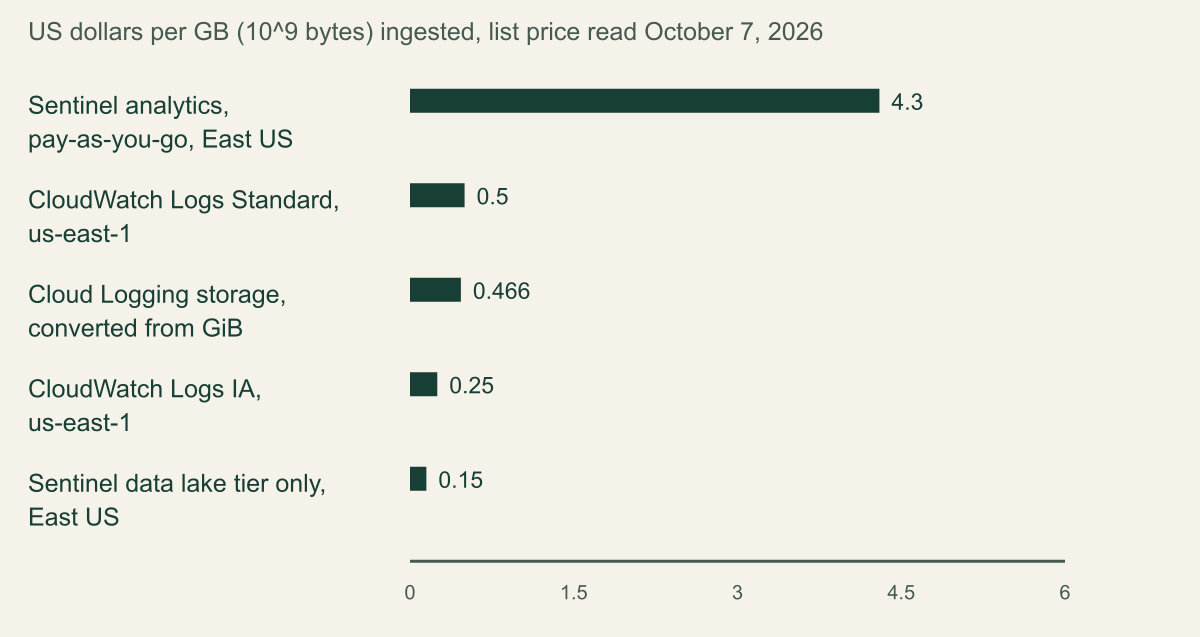
The chart puts the five ingestion prices on one axis in US dollars per decimal GB. Two values are calculated: the Sentinel lake-only figure adds the $0.05 ingestion and $0.10 processing meters that both apply to lake-only tables, and Google's $0.50 per GiB is divided by 1.073741824 to give about $0.466 per GB. [2][8][9][16] Storage per GB-month and query per GB scanned are deliberately left out of the chart because they are different units.
The bars are not like-for-like products. Sentinel's analytics price includes 90 days of retention and unmetered interactive queries. [7][8] CloudWatch ingestion excludes storage, which is billed at $0.03 per GB-month. [2] Google's storage charge includes 30 days and querying. [16] Commitment tiers can also cut the analytics rate well below pay-as-you-go; Microsoft advertises savings of up to 52 percent. [9] Compare against your negotiated or committed rate, not the list price alone.
On the cheap side, cost moves to query time. Both Sentinel lake queries and CloudWatch Logs Insights are listed at $0.005 per GB scanned. [2][9] As a hypothetical, a hunt that scans 30 days of a firewall table ingesting 200 GB per day reads 6,000 GB and costs about $30 per full run at that rate. That is trivial for a monthly investigation and expensive for a detection that polls the same range every 15 minutes. Price the scan pattern of each replacement detection before celebrating the ingestion saving.
List ingestion price per GB by tier
Lake-only ingestion in East US is about 3.5 percent of the Sentinel pay-as-you-go analytics rate; CloudWatch IA halves Standard. [2][9]

Source. AWS Price List offer file for CloudWatch in us-east-1, Microsoft Sentinel pricing page for East US and Google Cloud Observability pricing, all read October 7, 2026. [2][8][9][16]
Method. Calculated. AWS and Sentinel analytics values are copied list prices. Sentinel data lake only equals Data lake ingestion 0.05 plus Data processing 0.10 USD per GB. Cloud Logging equals 0.50 USD per GiB divided by 1.073741824 GB per GiB. Custom log rates only; vended log tiers, commitment tiers, storage and query prices are excluded.
Accessible table and figure data
| Tier and region | USD per GB | What the price includes |
|---|---|---|
| Sentinel analytics, pay-as-you-go, East US | 4.3 | 90 days retention and queries |
| CloudWatch Logs Standard, us-east-1 | 0.5 | Ingestion only |
| Cloud Logging storage, converted from GiB | 0.466 | 30 days storage and queries |
| CloudWatch Logs IA, us-east-1 | 0.25 | Ingestion only |
| Sentinel data lake tier only, East US | 0.15 | Ingestion and processing |
| Tier and region | USD per GB | What the price includes |
|---|---|---|
| Sentinel analytics, pay-as-you-go, East US | 4.3 | 90 days retention and queries |
| CloudWatch Logs Standard, us-east-1 | 0.5 | Ingestion only |
| Cloud Logging storage, converted from GiB | 0.466 | 30 days storage and queries |
| CloudWatch Logs IA, us-east-1 | 0.25 | Ingestion only |
| Sentinel data lake tier only, East US | 0.15 | Ingestion and processing |
Place each source by its readers
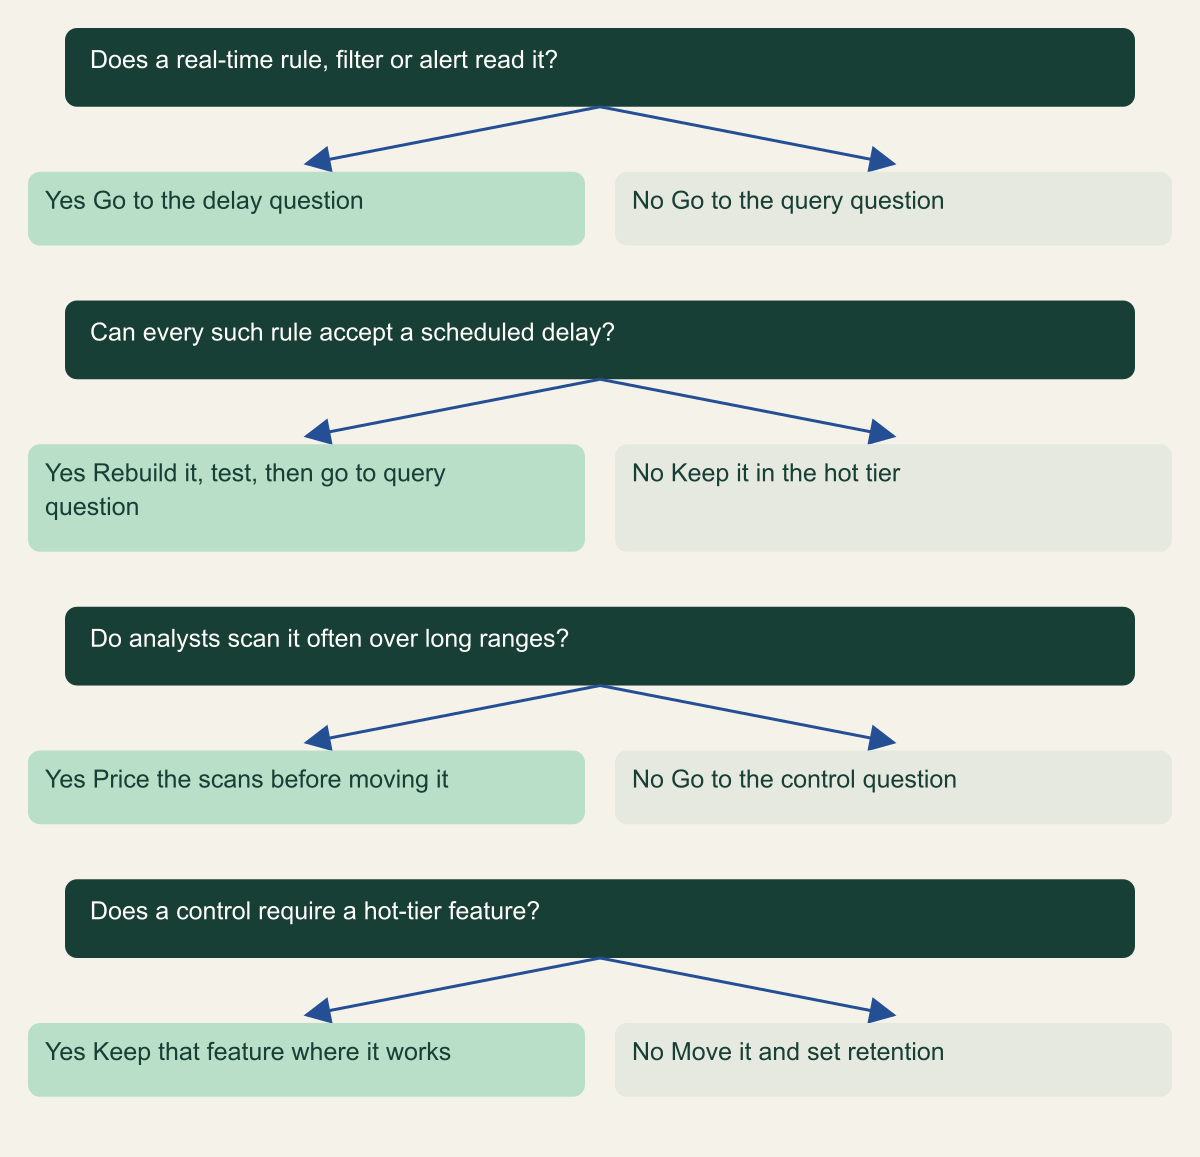
Run each log source through the questions in the decision tree in order. The first question is about readers, not volume, because a single metric filter or analytics rule can make a high-volume source expensive to move. The second asks whether every detection that reads the source can tolerate the delay of a scheduled replacement: a cron-driven scheduled query in CloudWatch, a KQL job that waits out the lake's ingestion latency, a summary rule whose bin is at least 20 minutes, or a log-based metric in Google. [4][12][13][18]
The remaining questions separate sources that are cheap to keep from sources that are cheap to store but expensive to query. A source that analysts search daily across weeks may cost more in scans on the lake side than it saves at ingestion. The starting placements below are reasoned from the documented capabilities above, not provider rules; adjust them to the detections you actually run.
- CloudTrail management events in CloudWatch Logs: keep the group Standard while CloudWatch.1 to CloudWatch.14 style metric filters or subscription forwarders read it. [5]
- Identity sign-in and cloud audit tables in Sentinel: analytics tier, as Microsoft classifies them as primary security data. [11]
- Firewall, proxy and flow logs: lake tier or IA, with a KQL job, summary rule or scheduled query for the few patterns that need automation. Microsoft's own job templates include hourly IOC matching on CommonSecurityLog and daily network traffic baselines. [12]
- Google Data Access audit logs: if you exclude a subset from
_Defaultto save storage, convert any log-based alert on that subset to a user-defined log-based metric first. [18] - Verbose application and debug logs: the cheaper class, with retention set explicitly on the new group or table.
Place a log source by its readers
Readers decide placement first; volume and query cost decide it second.

Source. Conceptual decision framework based on the capability and pricing documentation cited in this guide. [1][5][7][12][13][18]
Method. Conceptual. An editorial order of questions, not a provider recommendation; thresholds for delay and scan cost are owner decisions.
Accessible table and figure data
| Question | Yes | No |
|---|---|---|
| Does a real-time rule, filter or alert read it? | Go to the delay question | Go to the query question |
| Can every such rule accept a scheduled delay? | Rebuild it, test, then go to query question | Keep it in the hot tier |
| Do analysts scan it often over long ranges? | Price the scans before moving it | Go to the control question |
| Does a control require a hot-tier feature? | Keep that feature where it works | Move it and set retention |
| Question | Yes | No |
|---|---|---|
| Does a real-time rule, filter or alert read it? | Go to the delay question | Go to the query question |
| Can every such rule accept a scheduled delay? | Rebuild it, test, then go to query question | Keep it in the hot tier |
| Do analysts scan it often over long ranges? | Price the scans before moving it | Go to the control question |
| Does a control require a hot-tier feature? | Keep that feature where it works | Move it and set retention |
Test that detections still fire
A tier move changes the evaluation engine, the schedule and often the query language of a detection, so treat it as a detection migration with fixtures, not a storage setting. Run the old and new paths in parallel for at least one full schedule cycle of the slowest replacement before cutting over, and keep the old path's alert as the reference result.
Each replacement mechanism fails in its own way, and the failure has to be visible. A scheduled query can complete with no resultCount in its event. [4] A KQL job can be rejected when the tenant's five concurrent executions are already running, or disabled when its source workspace is deleted. [12] A summary rule skips a bin after ten failed attempts and is put on hold after eight consecutive bin retries. [13] Alert on those states with the same urgency as the detection itself, because each one looks like a quiet day.
- Inventory every reader of the source: rules, metric filters, subscription filters, log-based alerts, dashboards, exports and compliance controls.
- Build the replacement detection next to the original and record its schedule, lookback and documented delay.
- Inject a benign, clearly labeled test event for each rule and record the time from event to alert on both paths.
- Compare hourly event counts between the old and new destinations for the same window to catch dropped or duplicated data.
- Confirm the failure signals of the replacement (failed runs, rejected jobs, skipped bins) reach an owner.
- Cut over the producer, then remove the old detection only after the new one has fired on a test event in production.
Where a tiering review should begin
Start with the inventory, not the invoice. List the ten largest sources by billed volume, then attach every reader to each one. Sources with no detection reader are the safe first moves, whatever their size, and they are often flow, firewall, proxy and verbose application logs. Move those first, set retention on the new destination and confirm that GuardDuty, Defender XDR advanced hunting or the _Required bucket still cover what you assumed they covered. [6][7][17]
Then take the sources that do have detection readers one at a time. Rebuild each detection on the cheaper tier's scheduled mechanism, write down the delay the owner accepts, run both paths until the new one fires on a test event and alert on its failure states. Leave a source in the hot tier when a detection cannot tolerate that delay, or when the replacement's query scans would cost more than the ingestion it saves.
Method and provenance
Source-led technical analysis of provider documentation, price lists and pricing pages reviewed on October 7, 2026, with an original capability matrix, decision tree and explicitly hypothetical examples.
No live AWS, Azure or Google Cloud environment was inspected and no detection was run. Prices are list prices for the stated regions and currency on the review date; feature statements are bounded to the cited documentation.
AI assistance. AI assisted research, drafting, chart and diagram production, and original artwork. No personal deployment experience, independent human review or live test is claimed.
Published under the Cloud Security Desk organizational byline. Read the practitioner guide policy.
References
- Log classes AWS. Accessed .
- Logs Insights QL commands supported in log classes AWS. Accessed .
- Understanding scheduled queries concepts AWS. Accessed .
- Security Hub CSPM controls for Amazon CloudWatch AWS. Accessed .
- GuardDuty foundational data sources AWS. Accessed .
- Manage data tiers and retention in Microsoft Sentinel Microsoft. Accessed .
- Plan costs and understand pricing and billing for Microsoft Sentinel Microsoft. Accessed .
- Microsoft Sentinel pricing (East US, USD) Microsoft. Accessed .
- Microsoft Sentinel data lake is now generally available Microsoft. Accessed .
- Log retention tiers in Microsoft Sentinel Microsoft. Accessed .
- Create jobs in the Microsoft Sentinel data lake Microsoft. Accessed .
- Aggregate data in a Log Analytics workspace with summary rules Microsoft. Accessed .
- Azure Monitor Logs table feature comparison Microsoft. Accessed .
- Configure a table plan in a Log Analytics workspace Microsoft. Accessed .
- Google Cloud Observability pricing Google Cloud. Accessed .
- Cloud Logging routing and storage overview Google Cloud. Accessed .
- Monitor your logs: alerting comparison Google Cloud. Accessed .