
A design guide for SREs and platform engineers configuring AWS, Azure and Google Cloud load balancers and Kubernetes probes, based on provider documentation and the Amazon Builders' Library reviewed in October 2026. It covers all-unhealthy behavior by platform, calculated detection and recovery times at defaults, a probe-depth decision tree and a test plan.
At a glance
Key findings
- AWS Application and Network Load Balancers fail open when every target is unhealthy; Google Cloud Application Load Balancers return HTTP 503, and Azure Standard Load Balancer sends no new flows unless
noHealthyBackendsBehaviorisAllProbedUp. [2][6][7][8][12] - At documented defaults, interval times unhealthy threshold gives a minimum of 10 seconds to mark a target unhealthy on Google Cloud, 30 on Kubernetes, 60 on ALB and NLB and 90 on Application Gateway v2, before timeouts. [2][6][11][12][13]
- Fail open does not trigger when a degraded dependency makes instances flap, which is why Amazon teams tend to keep fast load balancer checks local. [1]
- ALB and NLB need five consecutive successes to restore a target by default, at least 150 seconds at the 30-second default interval. [2][6]
- Kubernetes warns that a badly designed liveness probe causes cascading restarts, while a failing readiness probe removes the Pod from Service endpoints without restarting it. [13]
What a health check decides
A load balancer health check is an automated decision to remove capacity. Every failed probe moves a target closer to being taken out of rotation, and the same check runs against every instance at the same time. So the useful design question is not how thorough the check can be but what happens when it fails everywhere at once. A check that queries a shared database fails on every instance when that database stalls, and the load balancer then acts on all of them together. [1]
The answer that follows from AWS's published practice and the provider documentation is short. Let the fast-acting load balancer check test only what is confined to the instance: the process answers, its own request path works and its local resources are usable. Send shared-dependency checks to monitoring or to slower automation that is rate limited and stops for a person. Then find out what your load balancer does when every target fails, because the products disagree. AWS Application and Network Load Balancers fail open, Google Cloud's Application Load Balancers return HTTP 503, and Azure Standard Load Balancer stops sending new flows unless you change a probe property. [1][2][6][7][12]
Timing comes third. At documented defaults, the calculated minimum time to mark a failed target unhealthy runs from 10 seconds on a Google Cloud health check to 90 seconds on an Azure Application Gateway v2 default probe. That number sets how long one broken instance keeps receiving traffic, and how fast a correlated failure can empty a pool. [11][12]
Shallow, local and dependency checks
The Amazon Builders' Library article on health checks sorts checks by how far they reach. Liveness checks confirm that a process listens on its port or returns HTTP 200 to a basic request, and a load balancer provides them without application code. Local health checks test resources the server does not share with its peers: whether it can read and write its disk, whether the business-logic process behind an on-server proxy is answering, whether support processes such as monitoring agents are running. Dependency health checks test whether the server can work with adjacent systems, including configuration freshness and connectivity to peers and downstream services. A fourth kind, anomaly detection, compares each server with the rest of the fleet. [1]
What separates the categories is how their failures correlate. A local check fails on one server because of something about that server, so removing that server is the right response. A dependency check can catch a local fault, such as expired credentials on one host, but it also fails whenever the dependency itself is in trouble, and then it fails on every server together. The article's rule is that automation should stop sending traffic to a single bad server but keep allowing traffic when the whole fleet appears to be having trouble. [1]
Shallow checks fail in the other direction. The same article recounts a rendering bug that made a few web servers return blank error pages, quickly. The existing check confirmed that the rendering process was running and responding, not that its responses were correct, and a load-balancing method that favored fast servers sent the broken ones more traffic. The article calls this a black hole: a failing server that attracts requests because it answers faster than its healthy peers. That is the case for a local check that exercises the real request path on the instance, not for one that calls the database. [1]
Some of the anomaly-detection layer now comes with the load balancer. Application Load Balancer's Automatic Target Weights compares each target's share of HTTP 5xx responses and connection errors with its peers, needs at least three healthy targets and runs independently of health checks, so a target can pass every health check and still be marked anomalous. With the weighted_random algorithm and anomaly mitigation turned on, it routes less traffic to anomalous targets and readjusts every five seconds. That covers the black-hole case without making the health check deeper. [4]
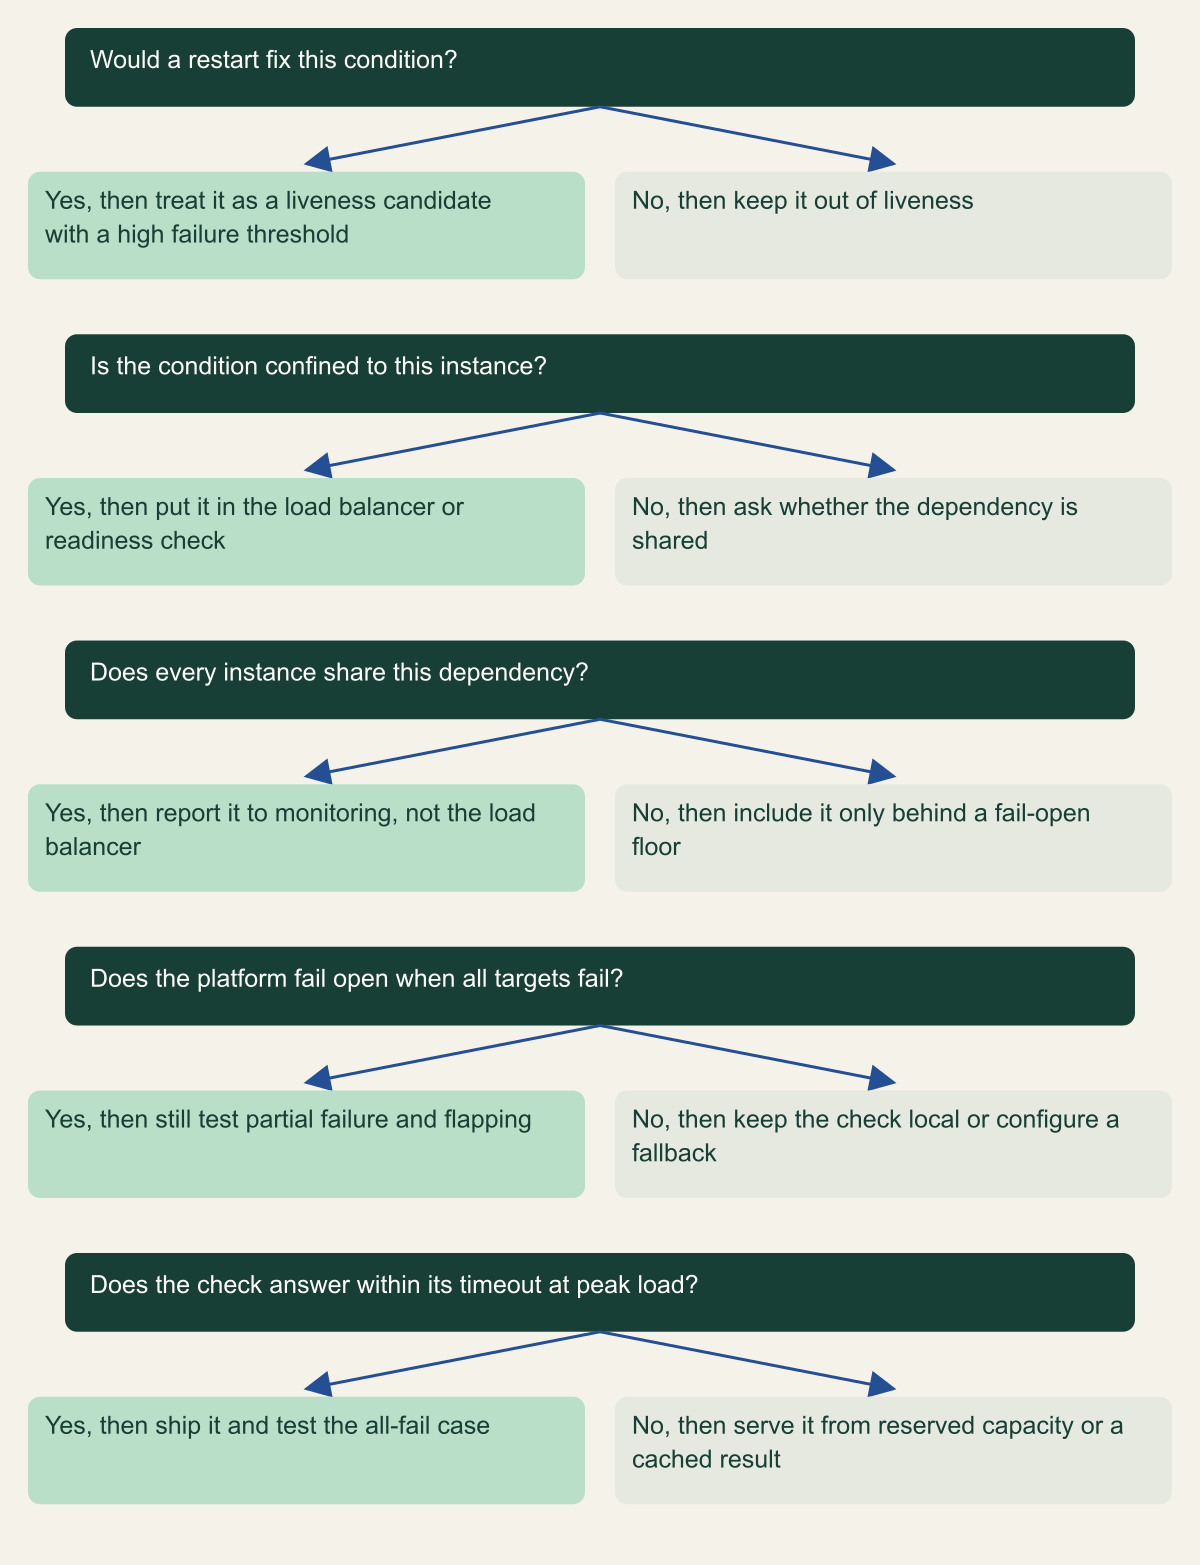
Decide what each probe is allowed to test
Only conditions confined to one instance belong in a check that removes instances. [1]

Source. Conceptual decision aid based on the Amazon Builders' Library health check guidance and the cited AWS, Azure, Google Cloud and Kubernetes documentation. [1][2][7][12][13]
Method. Conceptual ordering of documented guidance. Each row is answered independently for each condition a probe might test.
Accessible table and figure data
| Question | Yes, then | No, then |
|---|---|---|
| Would a restart fix this condition? | treat it as a liveness candidate with a high failure threshold | keep it out of liveness |
| Is the condition confined to this instance? | put it in the load balancer or readiness check | ask whether the dependency is shared |
| Does every instance share this dependency? | report it to monitoring, not the load balancer | include it only behind a fail-open floor |
| Does the platform fail open when all targets fail? | still test partial failure and flapping | keep the check local or configure a fallback |
| Does the check answer within its timeout at peak load? | ship it and test the all-fail case | serve it from reserved capacity or a cached result |
| Question | Yes, then | No, then |
|---|---|---|
| Would a restart fix this condition? | treat it as a liveness candidate with a high failure threshold | keep it out of liveness |
| Is the condition confined to this instance? | put it in the load balancer or readiness check | ask whether the dependency is shared |
| Does every instance share this dependency? | report it to monitoring, not the load balancer | include it only behind a fail-open floor |
| Does the platform fail open when all targets fail? | still test partial failure and flapping | keep the check local or configure a fallback |
| Does the check answer within its timeout at peak load? | ship it and test the all-fail case | serve it from reserved capacity or a cached result |
What happens when every target fails
This is the question that decides whether a deep check is an inconvenience or an outage, and each platform answers it differently. The table records the documented behavior when every target or backend in a pool is unhealthy.
On AWS, fail open belongs to the target group. If a target group contains only unhealthy targets, Application Load Balancer routes requests to all of them regardless of health. Network Load Balancer first removes the IP address of any zone with no healthy target from DNS, and fails open only if every target fails in every enabled zone; an empty target group also fails open. Before that point, NLB answers packets on client connections to an unhealthy target with a TCP RST. [2][6]
Azure Standard Load Balancer has the opposite default. When all instances probe down, no new flows go to the backend pool, although established TCP flows continue if the pool has more than one instance. The probe property noHealthyBackendsBehavior accepts AllProbedDown, which is that default, or AllProbedUp, which sends incoming packets to all instances when all are probed down; the health status view then reports the reason code Up_Probe_AllDownIsUp. Application Gateway's nearest control is MinServers, which always marks a set number of servers healthy whatever the probes report. It can be set only through PowerShell, the Azure CLI or ARM templates, and Microsoft warns that it can send traffic to failing servers and produce 502 errors. [7][8][10][11]
Google Cloud's proxy-based load balancers do not fail open. Global and regional Application Load Balancers return HTTP 503 when every backend is unhealthy, the classic Application Load Balancer returns 502, and proxy Network Load Balancers terminate new TCP connections. Passthrough Network Load Balancers spread traffic across unhealthy backends as a last resort; global ones first fail over to the next region, and internal or backend-service-based regional ones can drop traffic instead through a failover policy. [12]
Kubernetes readiness has no documented fallback. When a readiness probe fails, the EndpointSlice controller removes that Pod's address from the EndpointSlices of every matching Service, and the documentation describes no exception for the case where every Pod fails together. The inference is direct: a readiness check that depends on a shared database can leave a Service with no ready endpoints. [13]
| Platform | When every target is unhealthy | Setting that changes it |
|---|---|---|
| AWS Application Load Balancer | Routes requests to all targets regardless of health | Target group health thresholds raise the trigger point |
| AWS Network Load Balancer | Drops zones with no healthy target from DNS, then fails open if all zones fail | Target group health thresholds |
| Azure Standard Load Balancer | No new flows; established TCP flows continue | noHealthyBackendsBehavior set to AllProbedUp |
| Azure Application Gateway | Stops forwarding to each unhealthy server; no all-unhealthy fallback documented | MinServers keeps a fixed number marked healthy |
| Google Cloud Application Load Balancers | HTTP 503 (classic: HTTP 502) | None documented |
| Google Cloud passthrough Network Load Balancers | Last resort: traffic spread across unhealthy backends | Failover policy can drop traffic instead |
| Kubernetes Service | Pods failing readiness leave every matching EndpointSlice | None documented |
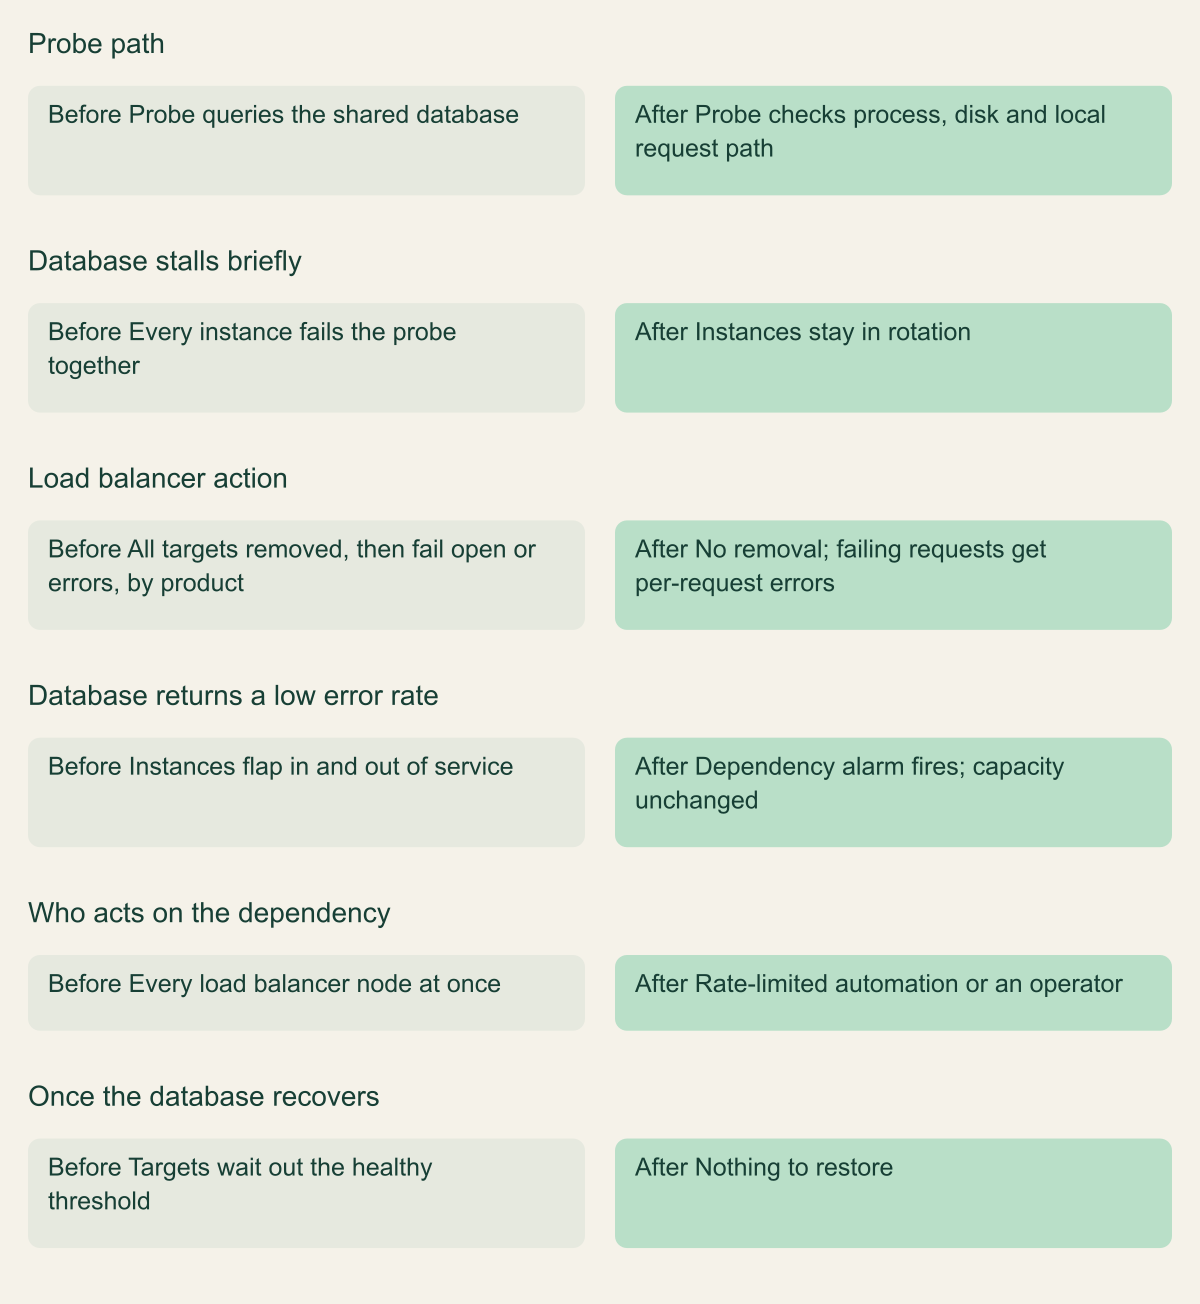
A deep check turns one stalled database into a fleet outage
Moving the dependency out of the probe keeps instances in service when the shared store stalls. [1]

Source. Conceptual comparison based on Amazon Builders' Library guidance and AWS, Azure and Google Cloud all-unhealthy behavior. [1][2][7][12]
Method. Conceptual hypothetical service; no environment was inspected or tested.
Accessible table and figure data
| Aspect | Before | After |
|---|---|---|
| Probe path | Probe queries the shared database | Probe checks process, disk and local request path |
| Database stalls briefly | Every instance fails the probe together | Instances stay in rotation |
| Load balancer action | All targets removed, then fail open or errors, by product | No removal; failing requests get per-request errors |
| Database returns a low error rate | Instances flap in and out of service | Dependency alarm fires; capacity unchanged |
| Who acts on the dependency | Every load balancer node at once | Rate-limited automation or an operator |
| Once the database recovers | Targets wait out the healthy threshold | Nothing to restore |
| Aspect | Before | After |
|---|---|---|
| Probe path | Probe queries the shared database | Probe checks process, disk and local request path |
| Database stalls briefly | Every instance fails the probe together | Instances stay in rotation |
| Load balancer action | All targets removed, then fail open or errors, by product | No removal; failing requests get per-request errors |
| Database returns a low error rate | Instances flap in and out of service | Dependency alarm fires; capacity unchanged |
| Who acts on the dependency | Every load balancer node at once | Rate-limited automation or an operator |
| Once the database recovers | Targets wait out the healthy threshold | Nothing to restore |
Fail open only covers the total failure
Fail open protects against one shape of failure: every target failing at once. AWS's article describes the shape it misses. If a shared data store becomes slow or returns a low error rate, servers fail their dependency checks now and then, flap in and out of service, and never all fail together, so the fail-open threshold is never reached while capacity keeps shrinking and returning. The article says Amazon teams tend to restrict fast-acting load balancer checks to local checks for this reason, since there is no general proof that fail open triggers as expected for every kind of overload, partial failure or gray failure. [1]
Application Load Balancer lets you move the trigger. The attributes target_group_health.unhealthy_state_routing.minimum_healthy_targets.count, default 1, and .percentage, default off, set the point at which the load balancer sends traffic to all targets, unhealthy ones included. A parallel pair under target_group_health.dns_failover marks a zone's load balancer node unhealthy in DNS when its healthy targets fall below the threshold, and its count also defaults to 1. When both are set, the DNS failover threshold must be greater than or equal to the routing threshold, and with cross-zone load balancing turned off the thresholds apply to each zone separately. [3]
AWS's documented example shows the effect. Two zones hold ten targets each, both thresholds are 50 percent, and six targets fail in one zone. With cross-zone load balancing off, that zone is at 40 percent: it is removed from DNS, and connections that still arrive there are spread across all ten of its targets, healthy or not. With cross-zone on, 14 of 20 targets are healthy, 70 percent, and nothing changes. A removed zone can keep receiving traffic until client caches drop its addresses, up to the 60-second DNS TTL. [3]
A percentage threshold turns fail open from a cliff into a floor. It does not fix flapping, which still needs a check that does not depend on the shared store, but it stops a partial failure from concentrating all traffic on the few targets that happen to be passing.
# Example: send traffic to all targets once fewer than half are healthy,
# and fail the zone out of DNS at the same threshold. Placeholder ARN.
aws elbv2 modify-target-group-attributes \
  --target-group-arn arn:aws:elasticloadbalancing:us-east-1:111122223333:targetgroup/example-tg/0123456789abcdef \
  --attributes \
    "Key=target_group_health.unhealthy_state_routing.minimum_healthy_targets.percentage,Value=50" \
    "Key=target_group_health.dns_failover.minimum_healthy_targets.percentage,Value=50"

# Then read back the setting and the current target states.
aws elbv2 describe-target-group-attributes \
  --target-group-arn arn:aws:elasticloadbalancing:us-east-1:111122223333:targetgroup/example-tg/0123456789abcdef
aws elbv2 describe-target-health \
  --target-group-arn arn:aws:elasticloadbalancing:us-east-1:111122223333:targetgroup/example-tg/0123456789abcdef \
  --query "TargetHealthDescriptions[].[Target.Id,TargetHealth.State,TargetHealth.Reason]" \
--output tableTiming and thresholds
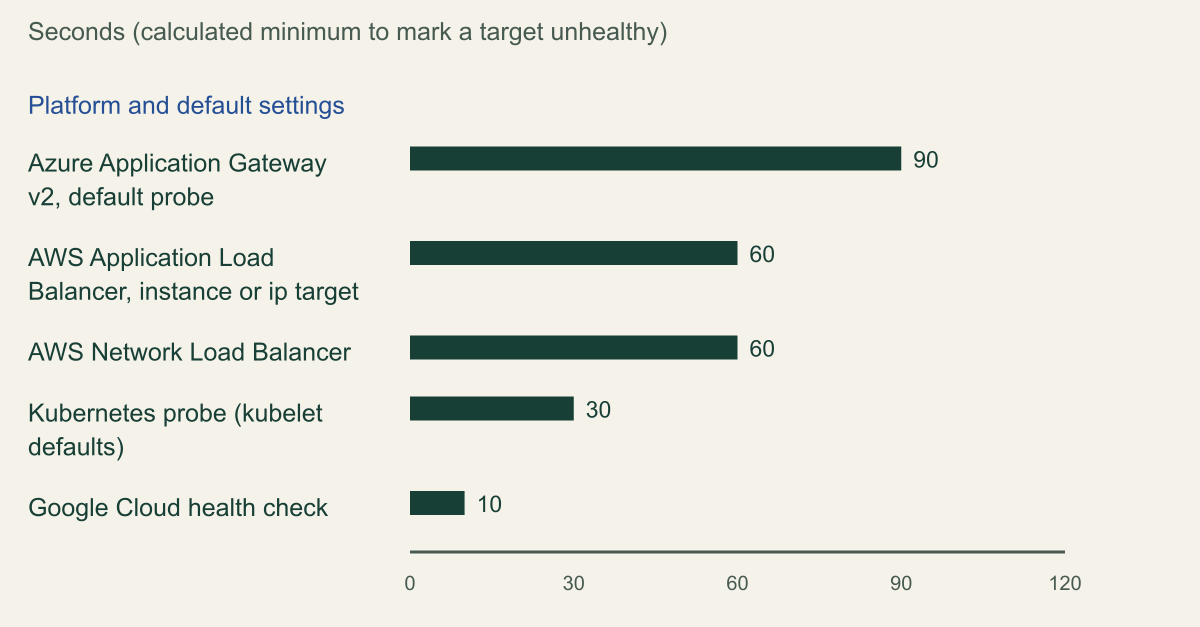
The chart multiplies each documented default interval by the default unhealthy threshold. It is a minimum detection estimate: the count of consecutive failed probes times the gap between them. It leaves out probe timeouts, the wait for the first probe after the fault begins and the time for every load balancer node to agree. A target that hangs instead of refusing connections takes longer, because each probe waits for its timeout before it counts as failed. [2][6][11][12][13]
Three products complicate the arithmetic. Application Gateway's own worked example, a 20-second interval with a threshold of 2, counts a first detection plus two further failed probes and arrives at 60 seconds, so its method adds one interval to the chart's formula; the v2 default probe also waits 30 seconds for each response, while v1 sends its follow-up probes in quick succession. Google Cloud runs several probers at once, each applying the configured interval and timeout, and marks a backend unhealthy when at least one prober sees two consecutive failures; Google says the number of simultaneous probers, which multiplies probe traffic to each backend, is generally between 5 and 10. Network Load Balancer checks are distributed and use a consensus mechanism, which also means targets receive more checks than configured. [6][11][12]
Azure Load Balancer is not in the chart because its defaults depend on the tool and its threshold depends on the protocol. The default interval is 5 seconds in the portal and 15 seconds through ARM templates, the REST API, the Azure CLI or PowerShell. The probe overview states no default threshold; the Azure CLI reference recommends keeping the --probe-threshold default of 1 and labels that property preview. For HTTP probes, an explicit non-200 response marks the instance down at once and the threshold applies only to timeouts. [7][8][9]
Recovery is slower than removal on AWS. Application and Network Load Balancers both default to five consecutive successes before a target returns, so at the 30-second default interval a recovered target waits at least 150 seconds, more than twice as long as it took to remove. Azure Load Balancer deliberately waits longer to restore an instance whose probe has been fluctuating. Slow recovery dampens flapping, but after a correlated failure it also means capacity comes back late and all at once, possibly into a backlog of retries. [2][6][7]
Choose the interval and threshold from the single-instance case: how long one broken instance may keep serving errors. Then run the same numbers against the all-instance case. A short interval detects one bad host quickly, and it also shortens the stall that can fail every host. With Google Cloud's defaults of 5 seconds and two failures, a shared dependency that stops answering for about 15 seconds can fail every backend's check, and an Application Load Balancer then returns HTTP 503. [12]
| Platform | Default healthy threshold and interval | Calculated minimum to return |
|---|---|---|
| AWS Application Load Balancer | 5 successes at 30 seconds | 150 seconds |
| AWS Network Load Balancer | 5 successes at 30 seconds | 150 seconds |
| Azure Application Gateway v2 default probe | 1 success at 30 seconds | Next successful probe |
| Google Cloud health check | 2 successes at 5 seconds | 10 seconds |
| Kubernetes readiness probe | 1 success at 10 seconds | Next successful probe |
Default settings detect a failed target in 10 to 90 seconds
Interval multiplied by unhealthy threshold, before timeouts, ranges from 10 seconds on Google Cloud to 90 seconds on Application Gateway v2. [2][6][11][12][13]

Source. Calculated from default interval and unhealthy threshold in AWS ALB and NLB, Azure Application Gateway, Google Cloud and Kubernetes documentation, reviewed October 7, 2026. [2][6][11][12][13]
Method. Minimum detection = default interval x default unhealthy threshold. A minimum estimate: excludes probe timeouts, the wait for the first failing probe, multiple probers and propagation. Azure Load Balancer is excluded because its default interval varies by tool and its overview states no default threshold. Application Gateway's own documented method adds one interval, giving 120 seconds at defaults.
Accessible table and figure data
| Platform and default | Interval (s) | Unhealthy threshold | Minimum detection (s) | Probe timeout (s) |
|---|---|---|---|---|
| Azure Application Gateway v2, default probe | 30 | 3 | 90 | 30 |
| AWS Application Load Balancer, instance or ip target | 30 | 2 | 60 | 5 |
| AWS Network Load Balancer | 30 | 2 | 60 | 6 HTTP, 10 TCP or HTTPS |
| Kubernetes probe (kubelet defaults) | 10 | 3 | 30 | 1 |
| Google Cloud health check | 5 | 2 | 10 | 5 |
| Platform and default | Interval (s) | Unhealthy threshold | Minimum detection (s) | Probe timeout (s) |
|---|---|---|---|---|
| Azure Application Gateway v2, default probe | 30 | 3 | 90 | 30 |
| AWS Application Load Balancer, instance or ip target | 30 | 2 | 60 | 5 |
| AWS Network Load Balancer | 30 | 2 | 60 | 6 HTTP, 10 TCP or HTTPS |
| Kubernetes probe (kubelet defaults) | 10 | 3 | 30 | 1 |
| Google Cloud health check | 5 | 2 | 10 | 5 |
Keep the check answerable under load
Overload is the case the Builders' Library singles out, because it lets a healthy fleet remove itself. An overloaded server rarely returns an error to the health check; it fails to answer before the timeout because CPU is contended, a garbage collector is pausing or every worker thread is busy. The load balancer removes it, its traffic moves to the rest of the fleet, and those servers slow down in turn. The article calls this a downward spiral and notes that a failed health check asks the load balancer to take a server out immediately and for a non-trivial time. [1]
The article gives three countermeasures. Size the server's worker pool above the proxy's maximum connections, from a handful of extra workers to double, so probes still find a thread. Enforce a concurrency limit inside the server that always admits health checks and rejects ordinary requests beyond the limit. Run expensive checks in a background thread that updates an isHealthy flag, so the probe handler only reads the flag. The last pattern needs its own guard, because if the background thread dies the flag stops changing and the server can no longer report failure or recovery. [1]
Probe volume needs the same attention. Every Application Gateway instance probes every backend independently at the configured interval, Google's probers multiply the configured rate, and NLB's distributed checks exceed the configured count; for NLB, AWS suggests a simple destination such as a static file, or a TCP check. On Kubernetes, each exec probe forks processes, which the documentation warns can add node CPU overhead at high pod densities and short intervals. A dependency check multiplied by every prober and every instance becomes a standing load test of that dependency. [6][11][12][13]
The example below applies the background-flag pattern with a staleness guard. Serving probes from a separate listener reserves capacity for them, which is why the local checks include a request to the application's own port: the probe should still fail when the application process is wedged.
# Example fragment: the probe handler only reads a result that a background
# thread refreshes from local checks. Paths, ports and limits are placeholders.
import shutil, threading, time, urllib.request
from http.server import BaseHTTPRequestHandler, ThreadingHTTPServer

STATE = {"healthy": False, "checked_at": None}
STALE_AFTER = 15  # seconds; a result older than this counts as unhealthy

def local_checks() -> bool:
    with open("/var/run/example-app/probe", "w") as f:  # disk is writable
        f.write(str(time.time()))
    if shutil.disk_usage("/var/log").free < 512 * 1024 * 1024:
        return False
    # The application process on this host answers its own request path.
    with urllib.request.urlopen("http://127.0.0.1:8080/internal/ping", timeout=2) as r:
        return r.status == 200

def refresh():
    while True:
        try:
            STATE["healthy"] = local_checks()
        except Exception:
            STATE["healthy"] = False
        STATE["checked_at"] = time.monotonic()
        time.sleep(5)

class Health(BaseHTTPRequestHandler):
    def do_GET(self):
        checked = STATE["checked_at"]
        fresh = checked is not None and time.monotonic() - checked < STALE_AFTER
        ok = self.path == "/healthz" and fresh and STATE["healthy"]
        self.send_response(200 if ok else 503)
        self.end_headers()

threading.Thread(target=refresh, daemon=True).start()
ThreadingHTTPServer(("0.0.0.0", 8081), Health).serve_forever()
Kubernetes probes
Kubernetes splits the decision three ways. A startup probe holds off the other two until the application has started, and the kubelet kills the container if it never succeeds. A liveness probe restarts the container once it fails more times than configured. A readiness probe removes the Pod from Service endpoints while it fails, runs for the container's whole life and never restarts anything. The defaults are periodSeconds 10, timeoutSeconds 1, failureThreshold 3 and successThreshold 1, and successThreshold must stay 1 for liveness and startup probes. [13]
Liveness is the dangerous one, because its action is a restart rather than a routing change. The documentation says a liveness probe should indicate unrecoverable failure, such as a deadlock, and warns that a wrong implementation causes cascading failures: containers restarted under high load, failed requests as the application loses capacity, and more work for the remaining Pods. It describes a common pattern of pointing liveness at the same cheap endpoint as readiness with a higher failureThreshold, so the Pod is marked not ready for a while before it is killed. Never put a dependency in a liveness probe; restarting every container does not repair a database. [13]
Readiness is where the Kubernetes documentation and the Builders' Library pull in different directions. Kubernetes suggests that when an application has a strict dependency on back-end services, the readiness probe can check that each required service is available, so traffic does not reach Pods that can only return errors. The Builders' Library warns that such a check fails on every server together. Both hold under different conditions: a dependency in readiness is reasonable when an empty Service is the honest answer or when a client can fail over elsewhere, and harmful when Pods could still serve cached reads or APIs that do not touch the dependency. [1][13]
Startup probes absorb slow starts without loosening liveness. Kubernetes recommends one when a container usually takes longer than initialDelaySeconds plus failureThreshold times periodSeconds to start, and its example allows 30 probes at 10 seconds, 300 seconds, before the kubelet gives up. For HTTP probes the kubelet treats any status from 200 to 399 as success, stops reading the body after 10 KiB and judges only the status code, so a body that says unhealthy under a 200 status still passes. [13][14]
# Example container fragment. Endpoint paths and timings are placeholders.
containers:
  - name: app
    image: registry.example.com/app:1.4.2
    ports:
      - name: http
        containerPort: 8080
    startupProbe:
      httpGet:
        path: /healthz
        port: http
      periodSeconds: 10
      failureThreshold: 30   # up to 300 seconds to start
    readinessProbe:
      httpGet:
        path: /ready         # local checks; shared dependencies only by decision
        port: http
      periodSeconds: 5
      timeoutSeconds: 2
      failureThreshold: 3
    livenessProbe:
      httpGet:
        path: /healthz       # process and local request path, no dependencies
        port: http
      periodSeconds: 10
      timeoutSeconds: 2
failureThreshold: 6 # not ready well before it is restartedTest the failure you designed for
Most health check defects only appear during the failure the check was meant to handle, so cause each failure on purpose, in a test environment or a controlled window, and time the platform's response. Five cases cover the design.
- One instance broken locally: make its disk read-only or stop its back-end process, and confirm that only that instance leaves rotation, within the time the chart predicts plus the timeout.
- Shared dependency down: block the database for every instance and confirm the documented all-unhealthy behavior for your platform, whether that is fail open, HTTP 503 or no new flows.
- Shared dependency degraded: add latency or a low error rate and watch for instances flapping in and out without ever reaching the fail-open point. [1]
- Overload: drive traffic past capacity and confirm that probes still return inside their timeout while ordinary requests are shed.
- Cold start and restart: start a new instance and confirm that startup or initial checks hold traffic until it is ready, with no liveness restarts during start.
Read the platform's verdict
During each test, record what the load balancer believed and why. aws elbv2 describe-target-health returns each target's state with a reason code: Target.Timeout when probes time out, Target.ResponseCodeMismatch when the status code is wrong, Target.FailedHealthChecks when the connection fails or the response is malformed. Adding --include AnomalyDetection shows the Automatic Target Weights result beside it, and ALB can also write health check logs to Amazon S3. [2][4][5]
Azure Load Balancer's health status view gives reason codes such as Down_Probe_HttpStatusCodeError, Down_Probe_TcpProbeTimeout and Up_Probe_ApproachingUnhealthyThreshold, the last meaning the most recent probe failed but earlier results still keep the instance up. To mark down one instance on purpose, Microsoft suggests a network security group rule that blocks the probe port or source address. The same page also calls blocking the probe with NSG rules unsupported and warns that such rules can take effect late, so treat removal times measured that way as approximate. [7][10]
Write the measured time to remove and to restore an instance next to the calculated minimum, and the observed all-fail behavior next to the documented one. A gap between them is a finding about your configuration, your probe path or the platform, and it belongs in the runbook before the next incident tests it for you.
Decisions to settle before tuning a probe
Start from the all-fail case rather than the check. Look up what your load balancer does when every target is unhealthy and decide whether that outcome is acceptable for the service. Then decide what belongs in the fast check: the process, the local request path and resources confined to the instance. Move shared dependencies to monitoring, anomaly detection or rate-limited automation that stops and calls a person once a threshold is crossed. [1]
Next, set the floor. Where the platform allows it, configure the point at which traffic goes to all targets, with the ALB percentage attributes or Azure's AllProbedUp, and know which platforms, such as Google Cloud's Application Load Balancers, give you no such floor. Choose interval and threshold from the single-instance case, check the recovery time as well as the removal time, and keep probes answerable under peak load. On Kubernetes, keep dependencies out of liveness and make readiness fail first. Then run the five tests. [3][8][12][13]
If one rule has to survive a design review, use this one: a check that can fail on every instance for the same reason must not be the thing that removes every instance.
Method and provenance
Source-led technical analysis of AWS, Microsoft, Google Cloud and Kubernetes documentation and the Amazon Builders' Library, with calculated defaults and original decision aids. Sources were reviewed on October 7, 2026.
No load balancer, cluster or live traffic was configured or measured. Detection and recovery times are calculated minimums from documented defaults and exclude timeouts and propagation; behavior is bounded to the cited documentation as of the review date.
AI assistance. AI assisted research synthesis, drafting, diagram planning and visual production, with deterministic editorial checks. No personal deployment experience, independent human review or live test is claimed.
Published under the Cloud Security Desk organizational byline. Read the practitioner guide policy.
References
- Implementing health checks (Amazon Builders' Library) Amazon Web Services. Published . Accessed .
- Health checks for Application Load Balancer target groups Amazon Web Services. Accessed .
- Target groups for your Application Load Balancers Amazon Web Services. Accessed .
- Edit target group attributes for your Application Load Balancer Amazon Web Services. Accessed .
- Check the health of your Application Load Balancer targets Amazon Web Services. Accessed .
- Health checks for Network Load Balancer target groups Amazon Web Services. Accessed .
- Azure Load Balancer health probes Microsoft. Accessed .
- Load Balancers - Create Or Update (REST API, 2025-09-01) Microsoft. Accessed .
- az network lb probe (Azure CLI reference) Microsoft. Accessed .
- Manage Azure Load Balancer health status Microsoft. Accessed .
- Health monitoring overview for Azure Application Gateway Microsoft. Accessed .
- Health checks overview Google Cloud. Accessed .
- Liveness, Readiness, and Startup Probes The Kubernetes Authors. Accessed .
- Configure Liveness, Readiness and Startup Probes The Kubernetes Authors. Accessed .