
A resource-focused DDoS planning guide using IETF and cloud-provider sources. Scoped Cloudflare observations support the discussion of bandwidth, packet processing, connection state and application work, alongside protected-path verification and legitimate-user tradeoffs.
At a glance
Key findings
- Bandwidth, packet rate, connection state and application work are different resource dimensions. [3][4]
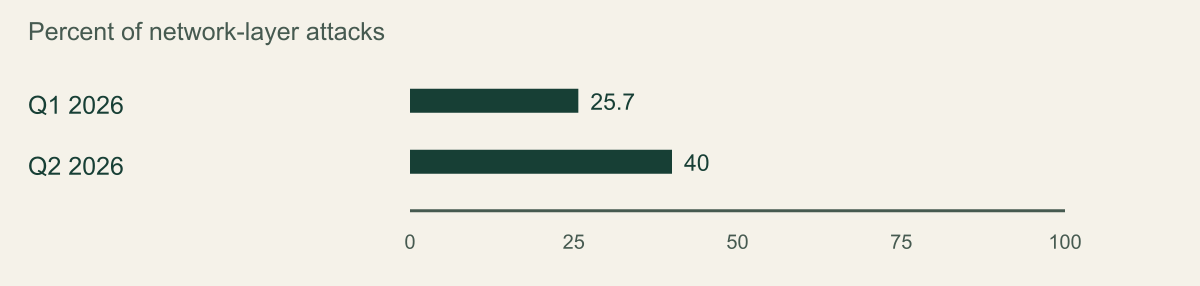
- Cloudflare reports DNS Flood shares of 25.7% in Q1 and 40.0% in Q2 2026 within its network-layer attack telemetry, not global incidence. [1][2]
- Verify the actual protected path and legitimate-user outcome before treating a mitigation as complete. [5][6][7]
The largest number may not name the failing resource
A terabit-per-second headline does not tell an operator whether a particular service is constrained by bandwidth, packet processing, connection state or application work. Those resources have different limits and need different observations. A useful DDoS response begins by locating the impaired boundary and confirming which controls can affect traffic before it reaches that boundary.
Consider a hypothetical service whose public web traffic passes through a protected edge. Its origin is also reachable through another path, and one uncached API operation creates expensive database work. The edge can be functioning as configured while another part of the service remains exposed to resource exhaustion. The provider's presence alone does not describe the complete protected path.
The IETF's denial-of-service considerations discuss multiple kinds of resource exhaustion. Current cloud guidance applies those concerns through service-specific architectures and controls. The practical implication is to match the response to the resource and protocol involved rather than selecting a product or rule because it appears beside a large attack statistic. [3][4]
Separate three questions. What resource is failing? Which traffic or behavior is contributing to that failure? Which authorized action can reduce the pressure while preserving legitimate use? The answers may develop at different speeds, and an early hypothesis should remain distinguishable from a confirmed observation.
This is a planning and response guide, not an instruction to generate attack traffic. No DDoS test or customer incident was performed for the article. The quantitative example is a narrowly scoped observation from Cloudflare's published report, and the service-path examples are conceptual.
Read the threat data with its denominator attached
Cloudflare's H1 2026 DDoS Threat Report covers January through June 2026 and was published on August 11, 2026. It reports that DNS Flood attacks accounted for 25.7% of its network-layer attacks in the first quarter and 40.0% in the second. The chart reproduces those two values without copying the report's artwork. [1]
The denominator is network-layer attack counts in Cloudflare's observed and mitigated telemetry. It is not all attacks on the Internet, the share of bytes crossing every cloud or the percentage of HTTP requests received by a particular application. That scope belongs in the caption as well as the surrounding explanation.
Cloudflare's methodology documentation distinguishes report distributions based on attack counts from byte-oriented network views in Radar. A distribution can therefore look different when the unit changes, even if the underlying observation period is similar. Always identify whether a comparison counts attacks, requests, packets or traffic volume. [2]
The increase between the two reported percentages is 14.3 percentage points. That subtraction is a calculated comparison, not a 14.3% relative increase and not a forecast for the reader's service. The chart provides context for reviewing DNS-related exposure; it does not establish that DNS floods will be the dominant local failure mode.
Vendor telemetry has a selection boundary. It reflects the vendor's customers, services, observation methods and mitigated traffic. Without a justified sampling model, those observations cannot be transformed into a global incidence estimate. Avoid using the chart to rank providers or infer that a different cloud sees the same distribution.
Geography and timing need similar restraint. An apparent source location does not identify the person directing an attack, and coincidence with a public event does not by itself prove causation. The response plan should focus on the service evidence it can observe rather than importing a geopolitical explanation from a threat-report narrative as an established fact.
DNS Flood share in Cloudflare network attack telemetry
Cloudflare DDoS Threat Report H1 2026, published August 11, 2026. DNS Flood shares are percentages of network-layer attacks observed and mitigated in Cloudflare telemetry. They are not global incidence or a forecast for an individual service.

Source. Primary sources [1] [2]. Reviewed August 28, 2026. Cloudflare DDoS Threat Report H1 2026, published August 11, 2026. DNS Flood shares are percentages of network-layer attacks observed and mitigated in Cloudflare telemetry. They are not global incidence or a forecast for an individual service.
Method. Cloudflare DDoS Threat Report H1 2026, published August 11, 2026 and reviewed August 28, 2026. Unit: percent of network-layer attack counts in Cloudflare telemetry. The DNS Flood values of 25.7% for Q1 and 40.0% for Q2 were transcribed from the report without extrapolation. The 14.3 percentage-point difference is a calculation from those reported shares, not a 14.3% relative increase. The denominator is not HTTP requests, bytes, packets, global attack incidence or an individual service forecast.
Accessible table and figure data
| Quarter | DNS Flood share percent |
|---|---|
| Q1 2026 | 25.7 |
| Q2 2026 | 40 |
| Quarter | DNS Flood share percent |
|---|---|
| Q1 2026 | 25.7 |
| Q2 2026 | 40 |
Map the resources the service actually consumes
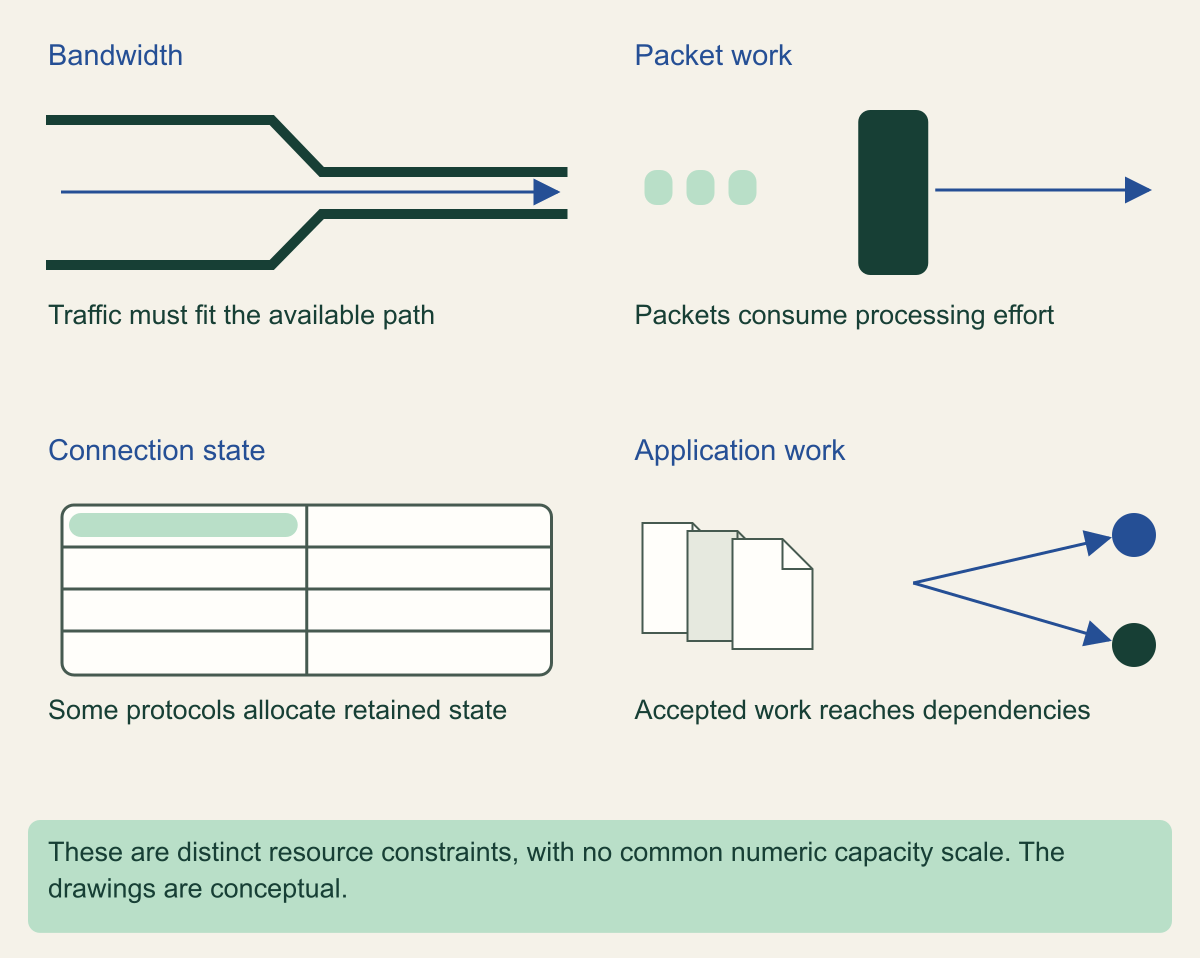
Bandwidth describes volume per unit time, usually expressed in bits per second. Packet rate counts packets per unit time. Those quantities are related through packet size, but they are not interchangeable descriptions of processing burden. A system's limits depend on the path and work required, so one impressive rate does not summarize every resource constraint. [3]
Connection state introduces another dimension. Some protocols and processing paths require a device or service to retain state for active interactions. The relevant observation may include concurrent state entries or the behavior of connection establishment, not only incoming bandwidth. The illustration treats that as a separate resource rather than placing all units on one numeric scale.
Application work can vary by operation. A request for an inexpensive cached object and a request that starts a costly database operation may have very different consequences despite counting as one request each. Review what the service does after accepting traffic, including calls to shared dependencies and any work that continues after the client stops waiting.
The hypothetical uncached API illustrates this boundary. If its database becomes the constrained resource, a healthy edge request count does not establish that the business operation is healthy. The useful response may involve an application control that reduces expensive work, a supported upstream protection or both. The choice depends on the actual path and evidence.
Map observation points alongside resources. An upstream interface can show a different view from an application log, and a proxy can reject traffic before it reaches an origin. A reduction in origin requests might reflect successful filtering, client failure or a routing problem. Connect the signals before deciding which interpretation fits the service state.
Also distinguish attack traffic from ordinary overload. A flash crowd, a replay job or a defective client can create symptoms that resemble hostile pressure. The immediate need to preserve service may be similar, but the incident classification and follow-up actions can differ. Do not turn an unexplained resource spike into a confirmed attacker claim.
The resource map should identify what remains unknown. If the team can see application saturation but lacks the upstream view, record that gap and request the appropriate provider evidence. A partial map can guide a bounded response; an invented complete explanation can direct controls at the wrong boundary.
DDoS pressure can reach different bottlenecks
Each resource has its own limiting unit and observation point; these units cannot be ranked on one scale.

Source. Primary documentation [3] [4] [6]. Reviewed August 28, 2026.
Method. Original conceptual synthesis reviewed August 28, 2026. Unit: qualitative states and relationships. Scope: Cloud DDoS bottleneck response planning. It is not measured performance, prevalence, risk or implementation proof. Each resource has its own limiting unit and observation point; these units cannot be ranked on one scale.
Accessible table and figure data
| Resource | Useful unit | Observation point |
|---|---|---|
| Network link | Bits per second | Upstream or edge interface |
| Packet processing | Packets per second | Network processing path |
| Connection state | Concurrent state entries | Proxy or connection tracker |
| Application work | Requests and cost per operation | Application and dependencies |
| Resource | Useful unit | Observation point |
|---|---|---|
| Network link | Bits per second | Upstream or edge interface |
| Packet processing | Packets per second | Network processing path |
| Connection state | Concurrent state entries | Proxy or connection tracker |
| Application work | Requests and cost per operation | Application and dependencies |
Confirm the protected path
Inventory the actual destinations users and systems can reach. Include names, addresses, ports, protocols, alternate endpoints and direct-origin paths where relevant. Then identify which protection service handles each path and what onboarding or configuration is required. A protection statement should refer to that inventory rather than an entire account by implication.
Cloudflare's attack-coverage documentation describes protection across specified layers and products, with some advanced features tied to particular services. The documented scope is not a promise that every protocol or independently reachable origin receives identical protection. Review the service in use and its relevant configuration before relying on a general coverage description. [7]
Azure DDoS Protection and Google Cloud Armor also describe their own service boundaries and integrations. Compare those documented capabilities against the workload's path instead of assuming the products are interchangeable. A useful review states what is protected, what remains a customer responsibility and which evidence would confirm that traffic traverses the intended control. [5][6]
Direct-origin exposure deserves a specific check. If traffic can bypass the intended edge, controls applied only at that edge may not affect the alternate route. The review should establish whether that route is required, how it is restricted and what happens during failover or maintenance. Do not assume an origin is hidden because ordinary DNS answers point elsewhere.
DNS itself is part of the path. A service can depend on authoritative resolution, recursive behavior and endpoint routing that have their own failure modes. Moving a DNS answer is not an instantaneous migration of every client. The related DNS failover guide explains those cache and connection boundaries without promising a universal propagation time.
Record the protection assumptions before an incident. Names and endpoints change, and a new service can be deployed outside an established path without changing the old diagram. A review trigger after routing, origin or provider changes is more useful than treating a past onboarding confirmation as permanent coverage.
Choose a control that reaches the bottleneck
Select the control location with the constrained resource in mind. If pressure consumes an upstream link, a control that runs only after traffic crosses that link may be too late to protect it. If accepted requests create expensive application work, a network-level filter may not by itself express the relevant business distinction. The response needs an effective enforcement point.
AWS's DDoS resiliency guidance discusses architectural measures across layers rather than relying on a single control. Use the current provider documentation to understand what a service can filter, absorb or distribute, then determine which measure is appropriate for the workload's failure scenario. Do not convert a reference architecture into an unconditional recovery guarantee. [4]
Filtering has a legitimate-user cost. A broad block can reduce pressure while excluding users who share an address range or other characteristic. A challenge designed for an interactive browser may not fit an API client. Review the supported traffic contract and preserve an observable path for legitimate use instead of treating every reduction in request volume as success.
Application admission can protect constrained work if it operates before that work begins. A service might refuse some requests, limit expensive operations or enter a declared degraded mode. Those choices need a defined user outcome and honest failure accounting. The error-budget and degradation article covers that operating boundary in more detail.
Be cautious with failover as an automatic response. A second destination needs usable capacity, dependencies, configuration and protection of its own. Moving traffic without those preparations can shift the problem or expose an alternate path. The existing static-stability guide explains why prepared recovery capacity matters before a regional transition.
Make temporary changes reviewable. Record the rule or policy changed, its intended effect, its scope, the approving authority and the condition for removal. A useful emergency control can become a long-term availability problem if its legitimate-traffic impact is never reassessed after the pressure subsides.
No generic guide can supply the correct threshold for an unknown service. Values must come from the provider's supported controls and the organization's measured operating envelope. A source-backed capability description is useful, but it should not be decorated with an invented safe request rate or a fabricated percentage reduction.
Prepare the evidence and escalation handoff
A provider escalation should identify the affected service path and the resource symptoms in their original units. Include the observation period, relevant endpoints, protection configuration and the legitimate-user effect. Preserve enough context for the receiving team to connect its telemetry with the organization's observations without sharing unnecessary sensitive application data.
Cloudflare's response guidance lists symptoms that can prompt investigation, including unusual traffic and service degradation. Such signs support a question; they do not prove that every slow service is under DDoS attack. Keep the current hypothesis, corroborating evidence and unresolved alternatives separate in the handoff. [8]
Name the internal decision owner and the people authorized to change protection settings or request provider assistance. An incident may require security, networking and application expertise at once. The service-impact decision should remain coordinated so one team does not restore a metric by making another critical user path unavailable.
Separate immediate operating evidence from attribution claims. The responder needs to know which traffic and resource observations justify the action. Identifying an attacker may require a different investigation and may remain unresolved. An effective containment or mitigation record does not need to invent that attribution to explain why the service was protected.
Retain changes and observations chronologically, with their source and scope. A graph from the provider and a graph from the application may have different aggregation windows. Record those differences rather than aligning them visually and implying a causal sequence the data does not establish.
The same Cloudflare report states that 90.60% of the network-layer attacks it mitigated in the first half of 2026 ended in under ten minutes. [1] That observation does not establish the duration of the next incident. It does support reviewing which controls are already in the traffic path and which require an operator to activate them. Record those prerequisites and authorities in advance, while checking the legitimate-traffic consequences of automatic enforcement.
Prepare access and escalation paths before an emergency. The team should know how to obtain the required provider view and who can authorize relevant changes. That preparation is an access and coordination exercise, not a reason to generate hostile traffic against a production service for article evidence.
Verify service outcomes after the response
Check the user outcome after the control is applied. A lower traffic rate or a quieter security dashboard is not enough if legitimate requests still fail. Observe the critical transaction, origin and dependency health, and any alternate path that was outside the first response. State which part of the service has recovered and which remains impaired.
Review false positives and unintended restrictions. A mitigation can preserve a service overall while affecting particular clients or operations. The organization needs an approved way to investigate those effects and adjust the control without abandoning the protection it still needs. Keep the tradeoff visible to the service owner.
Compare the observed result with the intended control mechanism. If the supposed bottleneck remains saturated, revisit the resource map. If the service improves but the mechanism is unclear, record that uncertainty rather than claiming the selected rule caused the improvement solely because it was changed near the same time.
Testing should be authorized and comply with the provider's conditions. A controlled exercise can evaluate a specific configuration and workload, but its scope must be stated. This article reports no such experiment and provides no attack-generation procedure. Readers should not infer measured capacity from the conceptual illustration or the vendor report chart.
Close with an updated resource-and-path record. Identify the constrained boundary, the effective controls, the legitimate-user consequences, the evidence retained and the remaining coverage gaps. That record gives the next response a concrete starting point without promising that the next event will use the same path or pressure the same resource.
The central planning question remains specific: which control can preserve the service's required work before the relevant resource is exhausted? Keeping units, paths and outcomes distinct makes that question answerable. A large attack statistic can provide context, but it cannot answer it for the operator.
Method and provenance
Primary documentation review and original operational analysis, checked August 28, 2026. Source versions, claim mappings and visual data are retained in the accompanying research dossier. This article was first published in the practitioner-guides collection on August 28, 2026.
No customer environment, incident evidence, production deployment or service performance was tested for this article. Hypothetical examples and conceptual diagrams are labeled. Chart values retain their stated source scope and must not be interpreted as organizational risk or measured implementation success. Organization-specific authorization, architecture and legal obligations require their own review.
AI assistance. Researched, drafted and checked against cited sources with AI assistance. No independent human editorial review or original empirical testing is claimed.
Published under the Cloud Security Desk organizational byline. Read the practitioner guide policy.
References
- Quarterly DDoS threat reports · Cloudflare Radar docs Cloudflare. Accessed .
- RFC 4732 Internet Denial-of-Service Considerations RFC Editor. Accessed .
- AWS Best Practices for DDoS Resiliency - AWS Best Practices for DDoS Resiliency Amazon Web Services. Accessed .
- Azure DDoS Protection Overview | Microsoft Learn Microsoft. Accessed .
- Cloud Armor overview | Google Cloud Armor | Google Cloud Documentation Google. Accessed .
- DDoS attack coverage · Cloudflare DDoS Protection docs Cloudflare. Accessed .
- Under a DDoS attack? · Cloudflare Fundamentals docs Cloudflare. Accessed .