
A practical evidence guide for AWS network investigations. It separates packet metadata, publication, search and application outcomes, then builds an auditable receipt around the conclusions a flow record can support.
At a glance
Key findings
- Aggregation intervals describe capture windows, not end-to-end detection latency. [1]
- Missing records can reflect unsupported traffic or collection problems rather than an absent connection. [2][5]
- Retain raw evidence, configuration history and the corroboration still needed before asserting application success.
Write the claim before searching the log
A VPC Flow Log can support a claim about observed network traffic, but it cannot by itself prove who intended that traffic, what the payload contained or whether an application completed its work. Start an investigation by writing the narrow statement you need to establish. Then select the record fields and independent evidence that can actually answer it.
AWS describes flow logs as records of IP traffic associated with network interfaces. Capture happens outside the traffic path. That is useful operationally, but it does not turn the record into a packet capture or an application transaction log. Treat the source as one observation layer, with its own configuration and exclusions. [6]
For example, a responder may ask whether a workload communicated with a particular destination during a suspected credential incident. A matching record can support the communication question. Establishing that a stolen credential authorized a sensitive operation requires identity and service evidence. Keep those questions separate even when the destination is associated with the suspected service.
An investigation worksheet should distinguish observation, interpretation and missing corroboration. Write the observed tuple and interface in the first column. Put the proposed explanation in the second. Put the application request identifier, service audit event or host context still needed in the third. This prevents a plausible network story from quietly becoming a settled account of the incident.
The guide below concerns interpreting authorized evidence. It does not claim that any traffic, account or incident was examined. Its examples are hypothetical, and its operational recommendations are a proposed review method rather than measured improvements in investigation speed or detection coverage.
Read the record as an aggregate
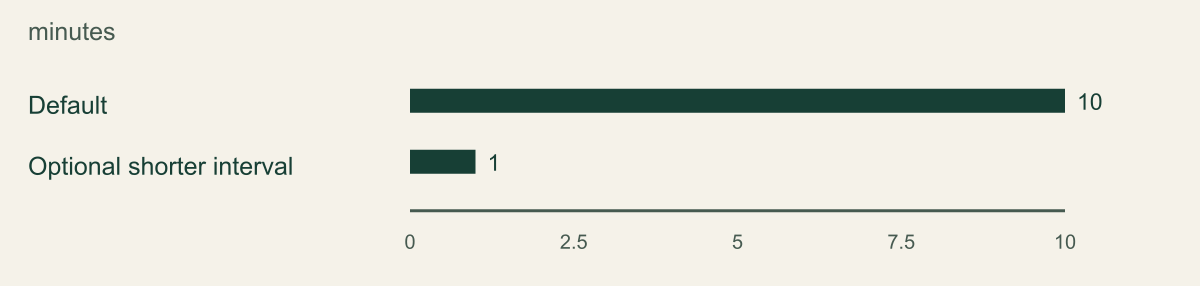
A flow record groups traffic over an aggregation interval. The default maximum interval is ten minutes, with a one-minute option; traffic on Nitro-based interfaces uses an interval of one minute or less regardless of that setting. These are capture aggregation limits, not promises about when a search will return the event. [1]
Read a record as a summary, not a transcript. Packet and byte counters describe the aggregate. TCP flags are combined across packets, so their presence does not preserve packet order. The start and end fields also have documented timing tolerances. An analyst should not draw a precise handshake or transaction sequence from those fields alone. [1]
The chart makes the configuration choice visible without implying that a shorter interval produces an equivalent improvement in alert latency. A team selecting one-minute aggregation may gain finer capture windows for its question. It still needs to check destination delivery, indexing and query behavior separately. There is no justified end-to-end latency calculation obtained by reading the bar height.
When a record spans a relevant application event, retain the original interval rather than replacing it with a single convenient timestamp. State whether a timeline uses flow start, flow end or destination ingestion. If several sources use different clock conventions, normalization should preserve the original values and the transformation used to compare them.
Avoid counting every record as a separate business request. One application operation can open several connections, while one reused connection can carry several operations. The useful aggregation level depends on the question. A connection inventory, a data-transfer estimate and a transaction investigation are not interchangeable simply because all three can start with the same network metadata.
Capture aggregation is not delivery latency
The one-minute option changes the maximum aggregation window, not the entire evidence pipeline. [1]

Source. AWS flow-log record documentation, reviewed September 2, 2026. [1]
Method. Direct transcription of documented limits. The Nitro caveat is explained in adjacent prose. No measured latency or SLA is represented.
Accessible table and figure data
| Configuration | Maximum aggregation minutes |
|---|---|
| Default | 10 |
| Optional shorter interval | 1 |
| Configuration | Maximum aggregation minutes |
|---|---|
| Default | 10 |
| Optional shorter interval | 1 |
Follow the address through the path
The address visible at an interface may differ from the original packet address. AWS supplies fields such as pkt-srcaddr and pkt-dstaddr for cases where that distinction matters. Use the field definitions for the actual resource and path; do not assume that srcaddr always identifies the originating application or person. [1] For regional NAT gateway flows, interface-id is a hyphen and resource-id identifies the gateway. Select the applicable resource identity rather than treating the absent interface value as proof that collection failed. [1]
Sketch the expected route before joining records. Include the workload, interface, translation point and destination. Label the address that each observer can see. This small exercise often exposes an attribution assumption that a large query would otherwise hide. The illustration shows an observation boundary rather than claiming that every networking arrangement produces the same fields.
In a hypothetical application using translated outbound access, an interface address might identify a shared network component. Assigning every matching connection directly to one user would be too strong. A defensible next step is to correlate the workload-side observation with application or host evidence that describes the relevant execution, preserving uncertainty where that relationship is not available.
Resource identity also changes over time. Preserve the interface identifier and the configuration context applicable to the investigation window. A current console display is useful orientation, but it should not silently replace historical evidence about which workload owned an address. The incident receipt should say which historical association was established and which was only inferred.
Do not expand collection merely because additional fields exist. Choose fields that close a specific attribution or path question, and consider their sensitivity. A richer custom record can help the next investigation, but it cannot add a missing field to traffic that was already captured under an earlier format. Configuration lineage belongs beside the evidence.
What the observation window leaves outside
Address metadata and aggregates need independent application evidence.

Source. Original editorial model informed by AWS documentation. [1][2][6]
Method. Conceptual relationship, not measured completeness. Equivalent table preserves the explanation without the illustration.
Accessible table and figure data
| Boundary | Useful observation | Not established |
|---|---|---|
| Packet path | Interface and packet address fields | Payload or user intent |
| Aggregation | Counters and combined flags | Exact packet sequence |
| Application | Independent result required | Business success from network acceptance |
| Boundary | Useful observation | Not established |
|---|---|---|
| Packet path | Interface and packet address fields | Payload or user intent |
| Aggregation | Counters and combined flags | Exact packet sequence |
| Application | Independent result required | Business success from network acceptance |

Separate capture from publication
For CloudWatch Logs delivery, AWS documents streams associated with interfaces and distinguishes the event timestamp from ingestion time. The former relates to the flow; the latter describes arrival in the logging system. A query ordered by ingestion can therefore answer a different question from one ordered by event time. [3]
Amazon S3 delivery introduces object publication and destination authorization as additional concerns. An object is a delivered container of records, not a guarantee that every relevant network observation was captured. Preserve object identity and collection time when the investigation depends on exported evidence, and keep destination problems separate from traffic conclusions. [4]
An operational review should identify four checkpoints: capture configured, record produced, record delivered and record found by the intended query. A green state at one checkpoint does not prove the next. Assign an owner to the gaps between them so that a network engineer is not asked to diagnose a search-permission problem from routing evidence alone.
For delayed evidence, compare the clocks with a clearly stated question. Are you measuring how long delivery took, whether the event fell outside a query window, or when an analyst first became aware of it? Those are different intervals. Retain raw timestamps and avoid converting a single observation into a general service-level guarantee.
A delivery test should use an authorized benign action with a known source and expected destination. Record what the test actually demonstrates: a particular path, configuration and receiver at that time. Do not extrapolate it into universal coverage. This article did not perform such a test, and the chart deliberately contains no invented delivery measurements.
Classify the missing evidence
No matching record has several possible meanings. AWS lists traffic that flow logs do not capture, including certain traffic involving Amazon DNS, instance metadata and DHCP. It also documents configuration constraints. The absence of a record for an excluded class is a capture limitation, not evidence that the activity did not happen. [2]
The log-status field helps distinguish outcomes. NODATA and SKIPDATA are not equivalent: one describes no traffic during the interval, while the other signals that records were skipped. Neither should be flattened into an ordinary zero in an investigation summary. Preserve the status and explain how it changes the confidence of the conclusion. [1]
Troubleshooting guidance adds other possibilities, including provisioning delay, no relevant traffic and delivery authorization problems. Before searching for an exotic explanation, verify the log resource, selected interfaces, destination and query scope. A search against the wrong receiver can look deceptively similar to successful collection of an empty interval. [5]
Use a short absence checklist rather than a blanket claim. Was the traffic class supported? Was the relevant resource included then? Did the configuration cover the interval? Is there evidence of skipped data or failed delivery? Can the investigator access the destination? Only after these questions are answered should the missing match influence a substantive incident conclusion.
The strongest available conclusion may still be limited. It is reasonable to report that no matching record was found in a specified collection under a stated query. It is stronger to claim that no connection occurred. The latter requires evidence about capture completeness that may be unavailable. Preserve that distinction in briefings as well as in the technical appendix.
Build an investigation receipt
A useful receipt makes the search understandable to someone who was not present. Include the incident question, time range and timezone, flow-log identifier, interface selection, field format, aggregation setting and destination. Identify the version of the query and retain the original result or a controlled reference to it. These are recommended recordkeeping fields, not a provider-mandated template.
Record the configuration that applied to the event window, not merely the configuration found during review. If a format or aggregation change required replacement, preserve the relationship between the old and new log resources. AWS documents that these properties cannot simply be changed on an existing flow log. [2]
Separate source evidence from derived analysis. A raw object or exported record should remain distinguishable from a worksheet that renames fields, converts timestamps or groups connections. The derived view can be useful, but later readers need to understand what was transformed. Avoid making a spreadsheet the only surviving version of the evidence.
Where integrity validation is available for another evidence stream, attach its result with a narrow description of what it establishes. Integrity of retained audit files does not prove completeness of flow capture. Conversely, a matching flow record does not validate the provenance of a separate application export. Different checks can complement each other without substituting for one another.
A receipt also needs unresolved items and owners. If historical interface ownership cannot be established, say so. If a destination access issue blocks retrieval, name the next review step without exposing credentials. This makes uncertainty actionable and reduces repeated work when an investigation passes from network operations to incident response or an application team.
For a shared destination, record the scope of any aggregation performed during analysis. Summing several interfaces can be appropriate for a transfer question while removing the workload distinction needed for attribution. Keep the original interface-level rows available, and state whether a reported total includes one direction or both. This is an analysis choice to review, not an extra field supplied by the flow-log service.
Test the benign explanation first
Consider a hypothetical report that a workload reached an unfamiliar service. The first useful distinction is between traffic accepted by network controls and a successful application operation. An ACCEPT record can coexist with an application rejection. The network observation should not be rewritten as proof that a privileged action completed.
A second hypothetical case has an expected request but no matching flow record. The responder initially suspects tampering. A capture review instead finds that the question concerns a traffic class excluded from this source. That explanation does not settle what happened at the application layer; it changes which source should be consulted next. The investigation becomes more precise without pretending that the missing record has been recovered.
Design a benign validation around the exact ambiguity. If the question is address attribution through translation, observe the approved path at the relevant boundaries. If it is destination publication, test receiver permissions and search visibility. Combining unrelated changes in one exercise makes a failed result difficult to interpret and can create unnecessary operational risk.
Keep the two directions of a conversation separate in the test record. A source-side request and an expected response may be observed at different boundaries, and the team should say which observation it actually obtained. If one side is missing, investigate that specific gap before describing the entire exchange as allowed or blocked. Ask the application owner which response would count as meaningful success and whether a dependency could have failed afterward. This turns a vague connectivity check into a bounded evidence exercise while avoiding an unsupported claim that a network record describes the whole transaction.
Define the expected evidence before running the exercise. Specify the observable action, relevant fields, destination and acceptance condition. Also define an allowed inconclusive outcome, such as an unavailable field that the resource does not support. A test should not pressure the operator to manufacture a complete-looking result when the collection contract is narrower.
Afterward, record the configuration and scope alongside the result. A successful benign connection says something about that test path. It does not establish that all future incidents, interfaces or protocols will be visible. Revalidate after meaningful changes to networking, collection or destination access, and preserve the difference between a proposed test and one that was actually executed.
Close on what remains unknown
The final incident statement should identify the evidence source, observation window and level of interpretation. For example, a team can say that a specified interface produced an accepted aggregate matching the destination tuple, while application success remains unverified. This is an example of bounded wording, not a finding about a real environment.
If the record is absent, name the collection reviewed and the known gaps. Do not bury SKIPDATA, unsupported traffic or unresolved receiver access in a footnote while the headline says that no communication occurred. Readers making containment or disclosure decisions need the uncertainty at the same level as the proposed conclusion.
Use the remaining uncertainty to choose the next source. API activity may address authorization, application logs may address transaction outcome, and host evidence may address the executing process. Some questions will remain unanswered because the necessary source was not collected or cannot be exposed by the service model. That is a limitation to retain, not a prompt to overinterpret the flow log.
Finally, feed a specific improvement back into collection design. Add a needed field, preserve configuration history, test a receiver boundary or clarify the query clock. Avoid a vague instruction to log everything. The practical objective is a record that answers an important question with known limits, and an investigation that remains accurate when those limits matter.
Method and provenance
Source-led technical analysis of directly reviewed project and vendor documentation, with original decision frameworks and explicitly hypothetical examples. Sources were reviewed on September 2, 2026.
No customer environment, live configuration, workload measurement or production test was inspected. Product behavior and limits are bounded to the cited documentation and stated review date.
AI assistance. AI assisted research synthesis, drafting, diagram planning and deterministic editorial checks. No personal deployment experience, independent human review or live test is claimed.
Published under the Cloud Security Desk organizational byline. Read the practitioner guide policy.
References
- Flow log records AWS. Accessed .
- Flow log limitations AWS. Accessed .
- Publish flow logs to CloudWatch Logs AWS. Accessed .
- Publish flow logs to Amazon S3 AWS. Accessed .
- Troubleshoot VPC Flow Logs AWS. Accessed .
- Logging IP traffic using VPC Flow Logs AWS. Accessed .