
Use Network Watcher to investigate a specific VM-to-service connection. Choose between Connection troubleshoot, IP flow verify and Next hop, preserve the test inputs, and verify the application after correcting the network cause.
At a glance
Key findings
- Use a specific source and destination with Network Watcher and separate network reachability from app health.
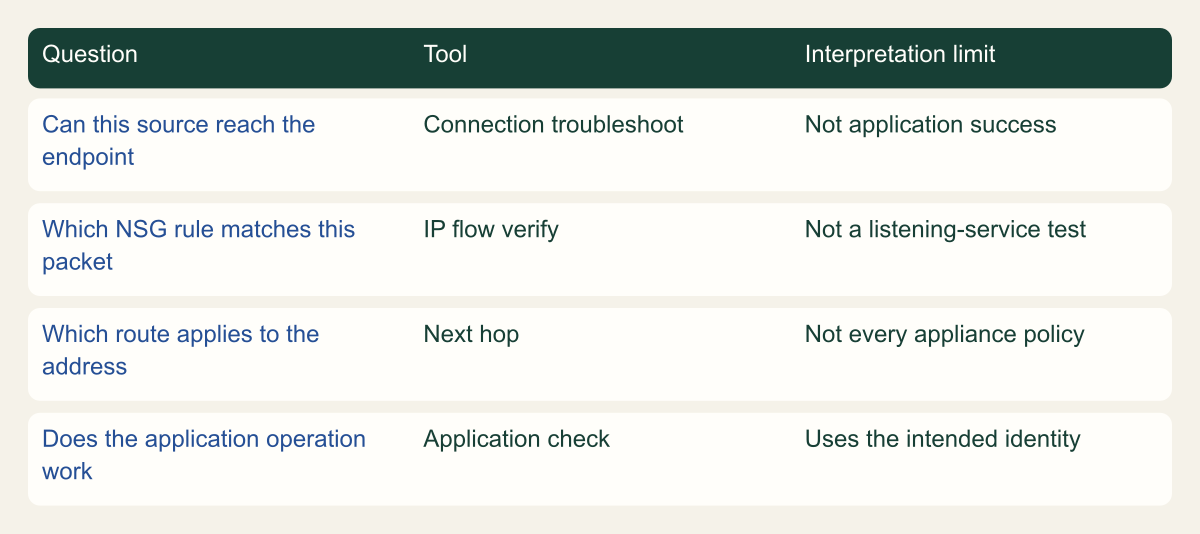
- A diagnostic decision framework separates connectivity, rule evaluation, routing and application checks.
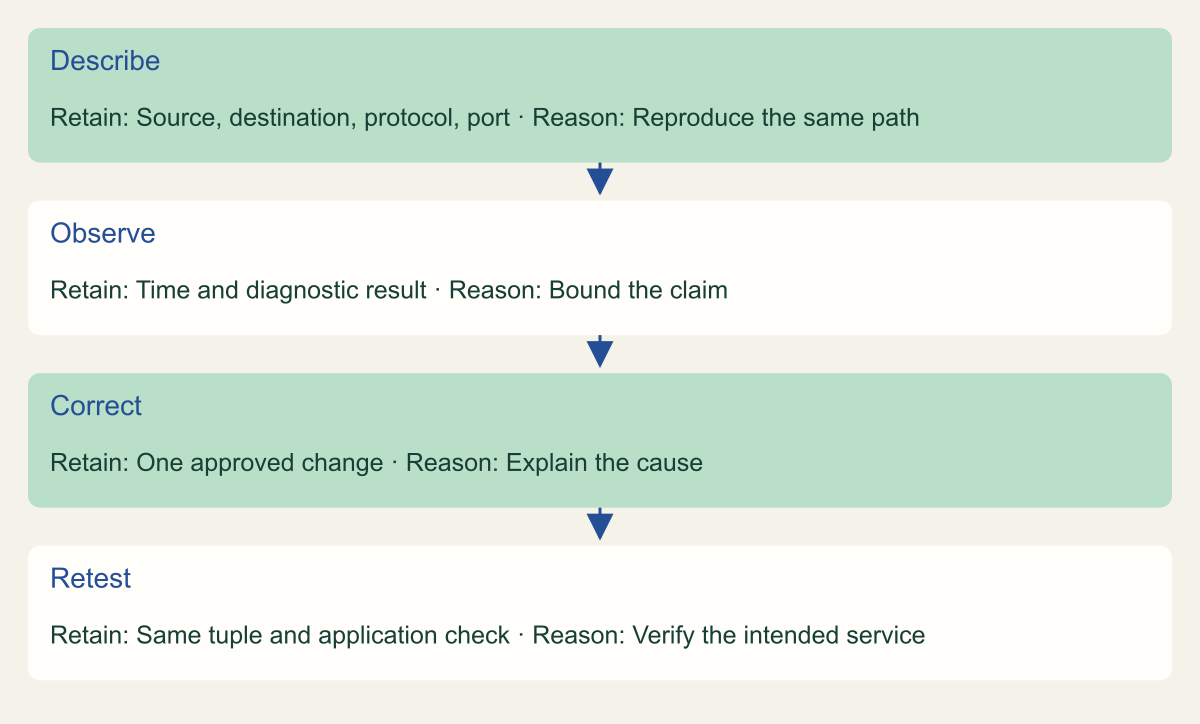
- Conceptual process map preserves a connection tuple through diagnosis, correction and application validation.
Describe the failing connection precisely
Use Azure Network Watcher Connection troubleshoot to test a named source resource against a specific destination and port. Then use its result to decide whether to inspect DNS, routing, security rules or the service itself. A result marked Reachable is evidence about that connection test. It is not proof that a user can sign in, an HTTPS certificate is valid or a database query will succeed. [1]
Write down the failing path before opening the tool. Include the source VM, destination hostname or address, protocol, destination port and the time the application failed. A hypothetical worker connecting to an internal API over TCP port 443 is a useful description. A note saying the network is broken is not, because different destinations and ports can take different paths or match different rules.
Use a destination that you own or are authorized to test. The diagnostic should answer an application problem, not discover unrelated services. If the application uses a hostname, retain that hostname in the initial test. Replacing it immediately with a remembered IP address can hide a DNS problem or bypass the endpoint the application actually uses.
The test must originate from the relevant Azure resource. A successful browser request from your laptop or Cloud Shell does not reproduce the VM's subnet, route table, DNS configuration or identity. Those other tests can help narrow the problem, but label them by their source. The source is part of the evidence, not an incidental detail.
Choose the right Network Watcher test
Connection troubleshoot provides an active connectivity check and diagnostic information for supported Azure sources. IP flow verify answers whether a specified packet would be allowed or denied by the applicable network security rules. Next hop identifies the route decision for a destination. These tools overlap, but they are not interchangeable. Choose the one that answers the question you are currently trying to resolve. [1] [3] [4]
For the first pass, use Connection troubleshoot with the actual destination and port. If the result identifies a security-rule issue, follow with an effective-rule review or IP flow verify. If the destination route is unexpected, use Next hop. This sequence keeps the investigation focused and avoids collecting a large set of diagnostics whose relationship to the failing request is unclear.
Microsoft's current Connection troubleshoot documentation describes an agentless experience as preview. Older procedures can require the Network Watcher VM extension. Check the experience supported for the selected source and environment instead of assuming every deployment either requires an agent or is fully agentless. Preview status matters when the organization restricts which diagnostic features may be used. [1]
Confirm that Network Watcher is available in the relevant region and that your account can perform the diagnostic. A disabled control or unsupported source is a setup issue. It is not evidence that the application path is blocked. Record the limitation and use a supported test rather than reporting an unavailable diagnostic as an Unreachable result.
Choose the diagnostic for the question
A diagnostic decision framework separates connectivity, rule evaluation, routing and application checks.

Source. Microsoft documentation: Connection Troubleshoot Overview - Azure Network Watcher [1]; IP Flow Verify Overview - Azure Network Watcher [3]; Next Hop Overview - Azure Network Watcher [4].
Method. Original conceptual synthesis of the cited Microsoft documentation. No deployment measurements or risk scores. Reviewed 2026-09-12.
Accessible table and figure data
| Question | Tool | Interpretation limit |
|---|---|---|
| Can this source reach the endpoint | Connection troubleshoot | Not application success |
| Which NSG rule matches this packet | IP flow verify | Not a listening-service test |
| Which route applies to the address | Next hop | Not every appliance policy |
| Does the application operation work | Application check | Uses the intended identity |
| Question | Tool | Interpretation limit |
|---|---|---|
| Can this source reach the endpoint | Connection troubleshoot | Not application success |
| Which NSG rule matches this packet | IP flow verify | Not a listening-service test |
| Which route applies to the address | Next hop | Not every appliance policy |
| Does the application operation work | Application check | Uses the intended identity |
Run Connection troubleshoot from the right source
Open Network Watcher, select Connection troubleshoot and choose the source resource. Enter the destination hostname, URI or address, then select the protocol and port that match the application's connection. Microsoft's procedure supports selecting available diagnostic tests such as connectivity, NSG diagnostics and next hop. Review the source and destination again before running the test. [2]
For an API request, TCP port 443 is a common test choice, but use the port your service actually listens on. A successful test on a different port does not explain the original failure. If a source port matters to the suspected rule, include it deliberately. Otherwise avoid inventing a specific source port that the application does not use.
Retain the diagnostic result with the timestamp and input values. Exported output or a concise incident note is usually more useful than a screenshot of a green status alone. The result should show which path was tested and what the tool reported. Do not copy Microsoft's sample probe counts or latency numbers into your record as if they were observations from your environment.
If the diagnostic cannot run, preserve that distinction. An authorization error, unsupported configuration or tool failure does not establish that the destination is unreachable. The next step is to resolve the diagnostic prerequisite or obtain a different authorized observation from the application host. Keep the evidence status explicit while the cause remains unknown.
Keep the hostname test and an address test separate when diagnosing DNS. If the hostname fails but an authorized test to the resolved target address succeeds, that narrows the investigation without proving the entire application is healthy. The application may still require the hostname for certificate validation or routing. Do not permanently replace its configured hostname with an IP address merely because the diagnostic behaves differently.
For a dual-stack environment, record whether the diagnostic used IPv4, IPv6 or both. An application and a manual test can choose different address families. A successful IPv4 check cannot establish the behavior of an IPv6 route or security rule. Match the selected protocol family to the failing request before interpreting the result as a reproduction of the incident.
When handing the case to another team, include the original input tuple along with the result. A screenshot that omits the selected VM or port is difficult to reproduce. The receiving team should be able to run the same authorized check or explain why its own observation uses a different path.
CSD_AZ_GROUP='example-app-rg'
CSD_SOURCE_VM='example-worker'
CSD_DESTINATION='api.example.com'
az network watcher test-connectivity --resource-group "$CSD_AZ_GROUP" --source-resource "$CSD_SOURCE_VM" --dest-address "$CSD_DESTINATION" --protocol TCP --dest-port 443Read the result as a specific observation
A Reachable result means the selected connection test succeeded under the observed conditions. An Unreachable result means it did not. Inspect the accompanying issues and hops instead of treating the status as a complete root cause. Connection troubleshoot can report information about DNS, routes, security rules, guest conditions and listening services, but the explanation still needs to be matched to the application's path. [1]
A low reported latency is not an application performance benchmark. The diagnostic's probes have their own timing and workload. They do not include the same authentication, request body, backend processing or database work as the application. Use the numbers to describe the test that ran, and use application telemetry for the user-facing operation.
If the tool reports a security rule, note whether it applies at the source or destination and whether the direction is inbound or outbound. A rule that permits inbound access on the destination cannot compensate for a separate outbound denial on the source. The next change should address the actual blocking condition while preserving the intended network restrictions.
Repeat a test only when it answers a useful question. A second observation after a relevant change can establish whether the path improved. Repeated probes without a hypothesis can add noise while the application continues to fail for an unrelated reason. State what each follow-up test is expected to distinguish before running it.
Use IP flow verify for a rule question
IP flow verify evaluates a packet description against Azure's applicable default and configured network security rules and identifies the allowing or denying rule. Supply the VM, network interface, direction, protocol, local address and port, and remote address and port. The packet description must match the connection under investigation. A test with a different source address can select a different rule. [3]
The tool is useful when a rule list contains several broad and narrow entries. Rather than guessing which one wins, test the relevant tuple and inspect the named rule. Then compare it with the intended management or application path. Do not assume that an Allow result proves the guest operating system has a listener or that a downstream firewall accepts the traffic.
Effective security rules combine the rules applicable to a network interface, including associated subnet and interface NSGs. Use that view to understand where the rule originates. A rule may be absent from the NSG you happened to open while still applying through another association. Record the resource ID of the relevant NSG so that the proposed change reaches the correct configuration. [5]
Keep a denied case in the acceptance plan when narrowing access. For example, an approved administration source should remain allowed while a different authorized test source should be denied. The latter test must be conducted on infrastructure you control. The aim is to verify a stated rule boundary, not to attempt connections to an unrelated person's VM.
Inspect the next hop for a route question
Next hop reports the route decision from a VM toward a specified destination address. It can help distinguish a virtual-network path, internet path, virtual appliance or absent route. Review the associated route information and compare it with the network design. A correctly written NSG rule cannot create a missing route. [4]
Use the address relevant to the failing connection. When the application starts with a hostname, first establish what address the VM resolves. Private endpoint scenarios are especially sensitive to this distinction because the same service name must resolve through the intended private DNS path. Testing an arbitrary public address may answer a different question from the one the application is asking.
If the next hop is a virtual appliance, involve its owner before changing Azure routes. The appliance may apply additional filtering or require a valid return path. The Network Watcher result provides a useful handoff point, but it does not automatically explain every policy enforced inside that device. Preserve the source, destination and timestamp for the appliance-side investigation.
Avoid adding a broad internet route simply because it makes one diagnostic succeed. The existing route may deliberately force inspection or private access. A proposed correction should restore the intended service path with the narrowest appropriate change. If the intended path is unknown, establish it with the network owner before turning a troubleshooting experiment into permanent configuration.
Check the service after the network path
Once the connection is reachable, test the application operation from the same host. For HTTPS, that includes the expected hostname and certificate validation. For a database, it includes the correct endpoint and an authorized harmless query. Do not disable certificate checks or substitute an administrator credential just to prove that something responds.
Separate the remaining failures by layer. A service can accept TCP and still reject the request because of authentication, authorization, request format or application state. A load balancer can also accept a connection while an application behind it is unhealthy. The network result is useful because it narrows the investigation; it should not end it prematurely.
A hypothetical VM might successfully reach an Azure Storage endpoint but receive an authorization error for a blob. That is a reason to inspect the application's credential and data role, not to open more network ports. Conversely, a valid data role cannot fix a hostname resolving to an unreachable private address. Keep both the network and application outcomes in the same incident record.
If the failure is intermittent, compare observations with application timestamps and relevant infrastructure changes. One successful diagnostic after the incident does not prove the earlier report was incorrect. State that the path was reachable at the later time and preserve the original failure evidence. Time is part of the scope of the claim.
Change one cause and retest
Make a small, reviewed correction that addresses the identified cause. That may be a DNS record, route association, security rule or service listener. Retest the same source, destination, protocol and port afterward. Changing several layers simultaneously may restore service, but it makes the explanation and rollback harder to assess.
Before changing a rule or route, record the original setting and the approved recovery path. A fix for one workload can affect others sharing the subnet or network interface. Where possible, use a narrow rule and a disposable test before applying a broader change. Do not remove an entire NSG to determine whether one entry is responsible.
Verify both the diagnostic and the user-facing operation. A successful network test followed by a failed application request means the work is incomplete for that application, even if the original network issue was fixed. A successful application request should still be checked against the intended access restrictions so that service was not restored by making it unnecessarily public.
Remove temporary diagnostics and exceptions according to their actual ownership. Preserve shared Network Watcher resources and existing monitors. If you created a temporary rule, identify it precisely and remove it after the approved test. The incident should end with a functioning intended path, not with forgotten broad permissions left behind for convenience.
Keep the connection inputs attached to the result
Conceptual process map preserves a connection tuple through diagnosis, correction and application validation.

Source. Microsoft documentation: Connection Troubleshoot Overview - Azure Network Watcher [1]; Troubleshoot Outbound Connections - Azure Network Watcher [2]; Effective Security Rules Overview - Azure Network Watcher [5].
Method. Original conceptual synthesis of the cited Microsoft documentation. No deployment measurements or risk scores. Reviewed 2026-09-12.
Accessible table and figure data
| Step | Retain | Reason |
|---|---|---|
| Describe | Source, destination, protocol, port | Reproduce the same path |
| Observe | Time and diagnostic result | Bound the claim |
| Correct | One approved change | Explain the cause |
| Retest | Same tuple and application check | Verify the intended service |
| Step | Retain | Reason |
|---|---|---|
| Describe | Source, destination, protocol, port | Reproduce the same path |
| Observe | Time and diagnostic result | Bound the claim |
| Correct | One approved change | Explain the cause |
| Retest | Same tuple and application check | Verify the intended service |
Turn recurring failures into useful monitoring
Connection troubleshoot is a point-in-time diagnostic. Connection Monitor is a separate capability for ongoing connectivity observation across supported endpoints. If the same path fails repeatedly, evaluate whether a maintained monitor with an owner and an actionable response would help. Do not assume that repeatedly running a manual diagnostic creates equivalent historical coverage. [6]
Choose monitoring targets that represent the service dependency and avoid collecting unrelated paths. Record what a failed check means and who can respond. A monitor for TCP reachability should not be described as a full transaction check. If the application requires a stronger health signal, define that separately rather than stretching the meaning of the network result.
Use current flow-log guidance if historical network records are needed. Microsoft has stopped creation of new NSG flow logs and documents their retirement on September 30, 2027, with virtual network flow logs as the migration path. A new guide should not build its evidence plan around enabling a retiring feature that no longer accepts new configurations. [7]
The durable output is an understandable connection record: source, destination, protocol, port, time, diagnostic result, identified cause and verified application outcome. That record helps the next operator choose the correct test instead of reopening every firewall. It also makes clear what the diagnostic did not establish, so that a green connection status does not become an unsupported claim about the whole service.
Method and provenance
Microsoft primary documentation was reviewed on September 12, 2026. The guide combines documented service behavior with original implementation guidance, conceptual figures and clearly identified hypothetical examples.
No Azure tenant, production application or customer deployment was executed or measured. Commands were checked against the cited references and locally parsed where applicable; the reader must verify permissions, service support and outcomes in the intended environment.
AI assistance. AI-assisted source research, drafting, original visual planning and consistency review. No firsthand deployment experience or human review is claimed.
Published under the Cloud Security Desk organizational byline. Read the practitioner guide policy.
References
- Connection Troubleshoot Overview - Azure Network Watcher Microsoft. Accessed .
- Troubleshoot Outbound Connections - Azure Network Watcher Microsoft. Accessed .
- IP Flow Verify Overview - Azure Network Watcher Microsoft. Accessed .
- Next Hop Overview - Azure Network Watcher Microsoft. Accessed .
- Effective Security Rules Overview - Azure Network Watcher Microsoft. Accessed .
- Connection Monitor Overview - Azure Network Watcher Microsoft. Accessed .
- Azure Network Watcher Overview Microsoft. Accessed .