
Separate a metric condition from telemetry silence, explain evaluation retrieval and provide a safe alarm test record. A missing CloudWatch data point should mean what the metric's publishing behavior makes it mean.
At a glance
Key findings
- A missing CloudWatch data point should mean what the metric's publishing behavior makes it mean. Silence from a heartbeat can indicate a problem. Silence from a counter that reports only errors may be normal. Configure the alarm after making that distinction, and test the notification path separately. CloudWatch offers four missing-data behaviors, but none can tell you what your application intended to publish. That part belongs to the metric's owner. [1]
- Separate a metric condition from telemetry silence, explain evaluation retrieval and provide a safe alarm test record.
- The diagrams are conceptual; documented numeric values describe AWS specifications, not a measured customer environment.
Decide what silence means for this metric
A missing CloudWatch data point should mean what the metric's publishing behavior makes it mean. Silence from a heartbeat can indicate a problem. Silence from a counter that reports only errors may be normal. Configure the alarm after making that distinction, and test the notification path separately. CloudWatch offers four missing-data behaviors, but none can tell you what your application intended to publish. That part belongs to the metric's owner. [1]
Start with the reader's likely problem: an alarm stays OK even though no data appears, switches to INSUFFICIENT_DATA, or raises an alert after the application becomes quiet. Those results can come from the selected missing-data option, the metric's dimensions, the evaluation period, or the availability of older real data points. Changing the missing-data setting without checking those inputs can hide the cause while making the alarm appear less noisy. [1][2]
This guide covers a standard metric alarm and its operational review. It does not recommend automatically stopping or terminating an EC2 instance because telemetry goes missing. AWS gives specific guidance for alarms that take EC2 stop, terminate, reboot, or recovery actions: treat missing data as missing and configure those actions for the ALARM state. A temporary reporting interruption can occur even when the instance is healthy. Follow that documented exception rather than applying a generic heartbeat rule. [1]
The useful end state is an alarm whose owner can explain the signal, threshold, expected publishing schedule, missing-data behavior, and action. The team should also know what a notification test proves and what an evaluation test proves. Keeping those questions separate makes the alarm easier to trust during an incident and easier to revise when the application changes its telemetry.
Read the metric contract before the alarm
Identify the exact metric namespace, name, and dimension set. CloudWatch treats each unique combination of dimensions as a separate metric. An alarm looking at an old instance identifier or the wrong service dimension may have no recent data even while a nearby chart shows activity. Verify the same metric identity in both the alarm configuration and the graph before deciding that the publisher has stopped. [3]
Read the publishing contract. Does the service emit a value every minute, only during requests, or only when an error occurs? If the team owns a custom metric, locate the code or agent configuration that publishes it. Record how normal idle periods are represented. An explicit zero and an absent data point are different inputs to the alarm. Do not assume that an application library fills every quiet period with zeros unless its behavior has been verified.
Check the statistic and period as well. A Sum over a longer period answers a different question from an Average or Maximum over a shorter period. The alarm's EvaluationPeriods and DatapointsToAlarm then define how many periods matter and how many must breach. A useful alarm description names the operational condition in ordinary language, such as repeated failed requests during active traffic, and links that condition to the chosen statistic and interval. [2][4]
Also inspect timestamps and publishing delays. CloudWatch uses timestamps when evaluating metric data, and the concepts guide recommends UTC. A custom publisher with an incorrect clock can make recent work appear outside the interval the alarm evaluates. Before changing thresholds, confirm the publisher's time handling and delivery status. Missing-data configuration is a policy for absent points, not a repair mechanism for an incorrect metric identity, timestamp, or collection pipeline. [3]
Choose among four missing-data behaviors
With notBreaching, missing points are treated as within the threshold. That can suit an error-only metric whose normal state is silence. With breaching, missing points count as outside the threshold, which may suit a continuously published signal where absence is itself operationally significant. With ignore, the alarm keeps its current state. With missing, a fully absent evaluation range can produce INSUFFICIENT_DATA. AWS documents missing as the default. [1]
Do not translate these options into universal labels such as safe and unsafe. An error counter configured as breaching can alert whenever there is no traffic. A heartbeat configured as notBreaching can look healthy when its publisher has disappeared. The same setting can be appropriate for one metric and misleading for another. Write the meaning of silence alongside the alarm, then choose the option that expresses that meaning.
Some service behavior overrides the general choice. The PutMetricAlarm reference states that alarms on metrics in the AWS/DynamoDB namespace always ignore missing data, even if another TreatMissingData option is selected. This is a reason to read the service-specific contract rather than assuming every alarm behaves like an arbitrary custom metric. If the team needs a separate signal for an unavailable dependency, design and test that signal explicitly. [4]
For EC2 alarms with stop, terminate, reboot, or recovery actions, preserve AWS's documented missing-data guidance. An alarm used only to notify a person and an alarm that changes infrastructure have different consequences. If one metric currently serves both purposes, review whether the actions should remain coupled. A simple initial notification is often easier to validate than a destructive response, but the decision should follow the application's requirements and the documented service behavior. [1]
Choose missing-data behavior from the signal
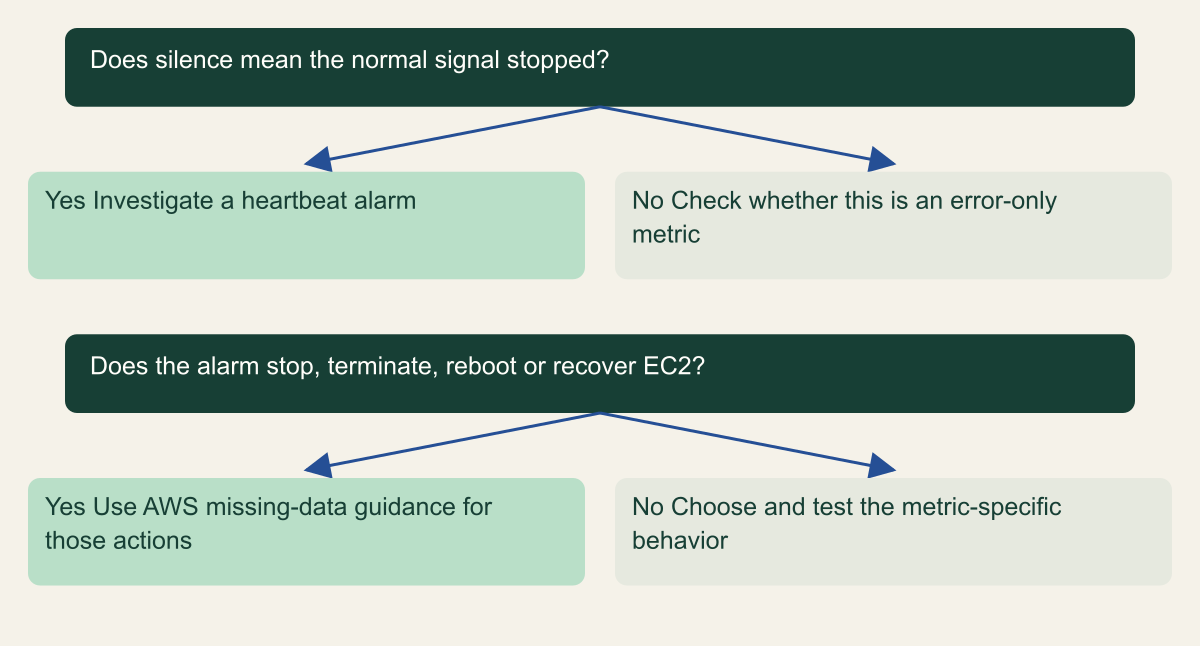
Choose missing-data behavior from the signal meaning, then check the special AWS guidance for EC2 action alarms.

Source. Conceptual synthesis of AWS documentation accessed September 12, 2026. [1] [4]
Method. Conceptual editorial synthesis of the cited service behavior; no measured outcomes. Scope: Should missing CloudWatch data mean healthy, unhealthy or unknown?
Accessible table and figure data
| Question | Yes | No |
|---|---|---|
| Does silence mean the normal signal stopped? | Investigate a heartbeat alarm | Check whether this is an error-only metric |
| Does the alarm stop, terminate, reboot or recover EC2? | Use AWS missing-data guidance for those actions | Choose and test the metric-specific behavior |
| Question | Yes | No |
|---|---|---|
| Does silence mean the normal signal stopped? | Investigate a heartbeat alarm | Check whether this is an error-only metric |
| Does the alarm stop, terminate, reboot or recover EC2? | Use AWS missing-data guidance for those actions | Choose and test the metric-specific behavior |
Understand why the result can surprise you
CloudWatch does not always fill every empty point immediately using TreatMissingData. During evaluation it retrieves additional recent points, and if enough real points exist, it can evaluate the alarm without using the missing-data setting. When real points are insufficient, it fills only as many as needed. That explains why a graph with gaps can still produce an ordinary OK or ALARM result under every missing-data option. [1]
An M out of N alarm means that M breaching data points are required within N evaluation periods. The breaching points need not be consecutive. A hypothetical two-out-of-three alarm can therefore behave differently from one that requires every period to breach. The example explains the configuration concept; it is not a claim about a measured environment. Review the actual DatapointsToAlarm and EvaluationPeriods before comparing the observed result with an expectation. [2][4]
Avoid writing your own simplified evaluator and then declaring CloudWatch incorrect when it disagrees. The missing-data documentation includes special cases, including how older breaching points and missing recent points can affect state transitions. The service's retrieval range also depends on the metric and alarm configuration. Use the published examples to understand the behavior, but do not claim that every alarm always retrieves one fixed number of extra points. [1]
When investigating a surprise, collect the alarm configuration, recent real points, state reason, and relevant history together. Include any changes made during the period. A screenshot of a graph alone may omit the missing-data choice or the previous evaluation state. The aim is to reconstruct the inputs that mattered to the decision, not to infer the entire evaluation from whether a line on the chart appears continuous.
Keep enough detail to explain an alert
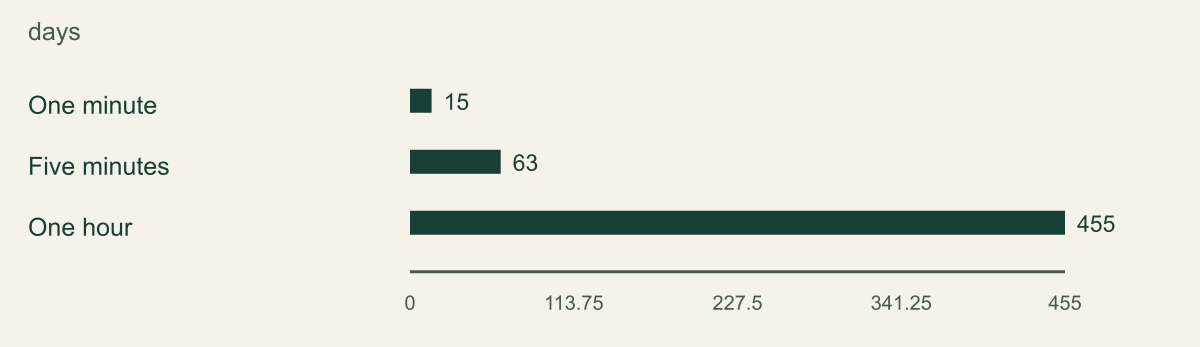
An alarm based on one-minute data is easier to review while that detail is still available. CloudWatch retains one-minute data for 15 days, five-minute data for 63 days, and one-hour data for 455 days. Older data is aggregated to coarser resolution. The chart shows those documented windows because an operator revisiting a short interruption much later may no longer have the resolution needed to reconstruct it. [3]
That is not a recommendation to retain every metric export forever. It is a prompt to decide what evidence an incident review needs. If a one-minute alarm mattered to a response, preserve the relevant configuration and time-bounded data while the detail is available. A later hourly graph can be useful for trend context, but it cannot recreate the individual minute-level observations merely because the service still has some historical data. [3]
Alarm history has its own window. AWS documents 30 days of CloudWatch alarm history, including state changes, and provides describe-alarm-history for retrieval. That history is distinct from the retention of the underlying metric. Store the relevant state reason and configuration change evidence in the controlled incident record when needed, with timestamps and account context. Do not assume that one retention setting controls both the metric and the alarm history. [2][7]
Capture only the evidence necessary for the review. A time-bounded export with the exact namespace, dimensions, period, statistic, and alarm name is more useful than an unexplained screenshot. If the review happens after fine-grained data has aggregated, say so. The remaining evidence may support that an alarm changed state, while leaving uncertainty about the individual inputs. That limitation should remain visible in the incident conclusion.
aws cloudwatch describe-alarm-history \
  --alarm-name "$CSD_ALARM_NAME" \
  --history-item-type StateUpdate \
--region "$CSD_AWS_REGION"Metric detail becomes coarser over time
One-minute metric detail lasts 15 days; older history becomes coarser. Metric retention and alarm-history retention are separate limits.

Source. AWS documentation accessed September 12, 2026. [3]
Method. Values transcribed from cited AWS documentation. Labels are editorial; this is not measured tenant data. Scope: Retention at each CloudWatch metric resolution for reviewing prior alarm decisions; longer history is progressively aggregated.
Accessible table and figure data
| Metric resolution | Retention in days |
|---|---|
| One minute | 15 |
| Five minutes | 63 |
| One hour | 455 |
| Metric resolution | Retention in days |
|---|---|
| One minute | 15 |
| Five minutes | 63 |
| One hour | 455 |
Verify the message and the action separately
An alarm can evaluate correctly while its notification fails to reach the intended person. Check the configured action, SNS topic, subscription status, topic permissions, and destination ownership. For an email subscription, the recipient must complete the confirmation process. A pending subscription is not a tested operational route. The SNS getting-started documentation separates creating the topic, subscribing a destination, and publishing a message for a reason. [5]
A direct SNS test demonstrates delivery through that topic to the subscribed destination. It does not demonstrate that the CloudWatch alarm will evaluate the metric as intended or has permission to publish through the complete configured path. Test the actual alarm action through an approved non-destructive exercise as well. Record which component was tested so a successful email is not mistaken for complete alarm validation.
The set-alarm-state operation can temporarily change an alarm's state for testing. AWS documents that a state change can invoke the action configured for that state, and a metric alarm can quickly return to its evaluated state. Treat this as a real action trigger. Do not run it against an alarm with stop, terminate, or other consequential actions merely to see what happens. Use a dedicated notification-only test arrangement when that fits the validation goal. [6]
Confirm who receives and handles the result. Delivery to an abandoned mailbox or an unmonitored queue is not useful incident coverage. The action record should name the team, escalation route, and expected handling of ALARM and recovery messages. If INSUFFICIENT_DATA is significant for this signal, decide how that state reaches an operator rather than assuming the primary threshold alert will also describe telemetry failure.
Give the test a recognizable nonsecret label and tell the receiving team when the exercise starts. Otherwise, a correctly delivered sample can waste incident-response time or be dismissed as noise without checking the route. Record whether the destination was merely reached or whether an operator acknowledged the message.
Run a controlled signal and silence exercise
Use a nonproduction metric and notification-only alarm to test the behavior when feasible. Match the publishing pattern, dimensions, statistic, period, and missing-data choice to the production design. Avoid copying sensitive metric labels or production identifiers into a public test. The test should exercise the specific question being reviewed, such as what happens when a periodic heartbeat stops, rather than create arbitrary data merely to obtain a screenshot.
Plan distinct phases: normal publishing, a controlled threshold breach, restored normal values, and a deliberate pause in publishing. Record the intended timestamps and the actual observed alarm history. Allow the configured evaluation periods to pass, and inspect the real data rather than predicting an exact transition second from a simplified diagram. No experiment was run for this guide; this is a proposed procedure for the reader's authorized environment. [1][2]
For an error-only metric, also test an ordinary idle period. The expected outcome should follow the chosen behavior and any service-specific exception. For a continuously reported metric, a pause tests telemetry silence, but it does not reproduce every possible application failure. The publisher might continue while the service is broken, or stop while the service remains healthy. Document what the signal measures so operators do not extend its meaning beyond the test.
Restore the publisher and approved alarm configuration after the exercise, then remove temporary test resources through the normal cleanup process. Preserve a small record of the configuration, inputs, observed states, and notification results. If the actual behavior differs from the intended contract, fix the metric or alarm and rerun the relevant phase. Do not simply silence the noisy state and call the test complete.
Record the alarm as an operational promise
An understandable alarm record contains the account and Region, exact metric identity, statistic, period, threshold, evaluation settings, missing-data choice, and configured actions. It also names the metric producer and the response owner. Add a plain sentence explaining what silence means. That sentence often exposes a mismatch faster than reviewing several console tabs separately because it forces the team to state what the alarm is supposed to tell them.
Keep the evidence boundaries explicit. A synthetic state change proves an action path under the tested conditions. A controlled metric test proves the observed evaluation behavior for that configuration. A production incident review shows what happened in a particular period. These results can support each other, but none alone demonstrates every future outage or every telemetry failure. Use the record to preserve those distinctions without burdening the operator with a large checklist.
Review the alarm when the publisher, metric dimensions, request pattern, deployment topology, or response action changes. An alarm designed for steady traffic can become misleading after a service adopts scheduled operation. A renamed dimension can leave the old alarm watching an inactive series. These are concrete maintenance triggers. A periodic review should also look for alarms with no current owner or no documented action beyond sending an email.
The useful question during an incident is whether the alarm reports an unhealthy measured value, an absent signal, or a routing problem. A well-designed CloudWatch alarm makes those possibilities easier to separate. Define the metric's meaning first, apply the appropriate missing-data behavior, and preserve enough evidence to explain its decisions. That produces an alert an operator can act on without guessing what an empty graph was intended to mean.
Method and provenance
Primary AWS documentation was retrieved and reviewed on September 12, 2026. The guide synthesizes documented service behavior into a bounded operational procedure; research records and figure data are maintained with the article.
Examples are hypothetical. Code and request shapes are checked locally where applicable, but no customer AWS account, production operation, recovery duration or benchmark was tested. Readers must verify their resource type, Region, permissions and organization controls.
AI assistance. AI assisted research organization, drafting and original visual planning. Sources, technical boundaries and final rendering are reviewed through the publication workflow.
Published under the Cloud Security Desk organizational byline. Read the practitioner guide policy.
References
- Using Amazon CloudWatch alarms - Amazon CloudWatch AWS. Accessed .
- Metrics concepts - Amazon CloudWatch AWS. Accessed .
- PutMetricAlarm - Amazon CloudWatch AWS. Accessed .
- set-alarm-state - AWS CLI 2.36.44 Command Reference AWS. Accessed .
- describe-alarm-history - AWS CLI 2.36.44 Command Reference AWS. Accessed .